Database Process List
The Database Process List in the server panel provides real-time visibility into all active database processes running on your server. This feature allows you to monitor and manage database connections, identify long-running queries, troubleshoot performance issues, and understand the current state of your database operations. By accessing this information directly from the Query Monitor tab, you can quickly assess database activity and take necessary actions to optimize performance.
To access the Database Process List, navigate to Server Panel → Server Metrics → Query Monitor tab. The database processes table is displayed below the query monitor chart.
MySQL/MariaDB Process List
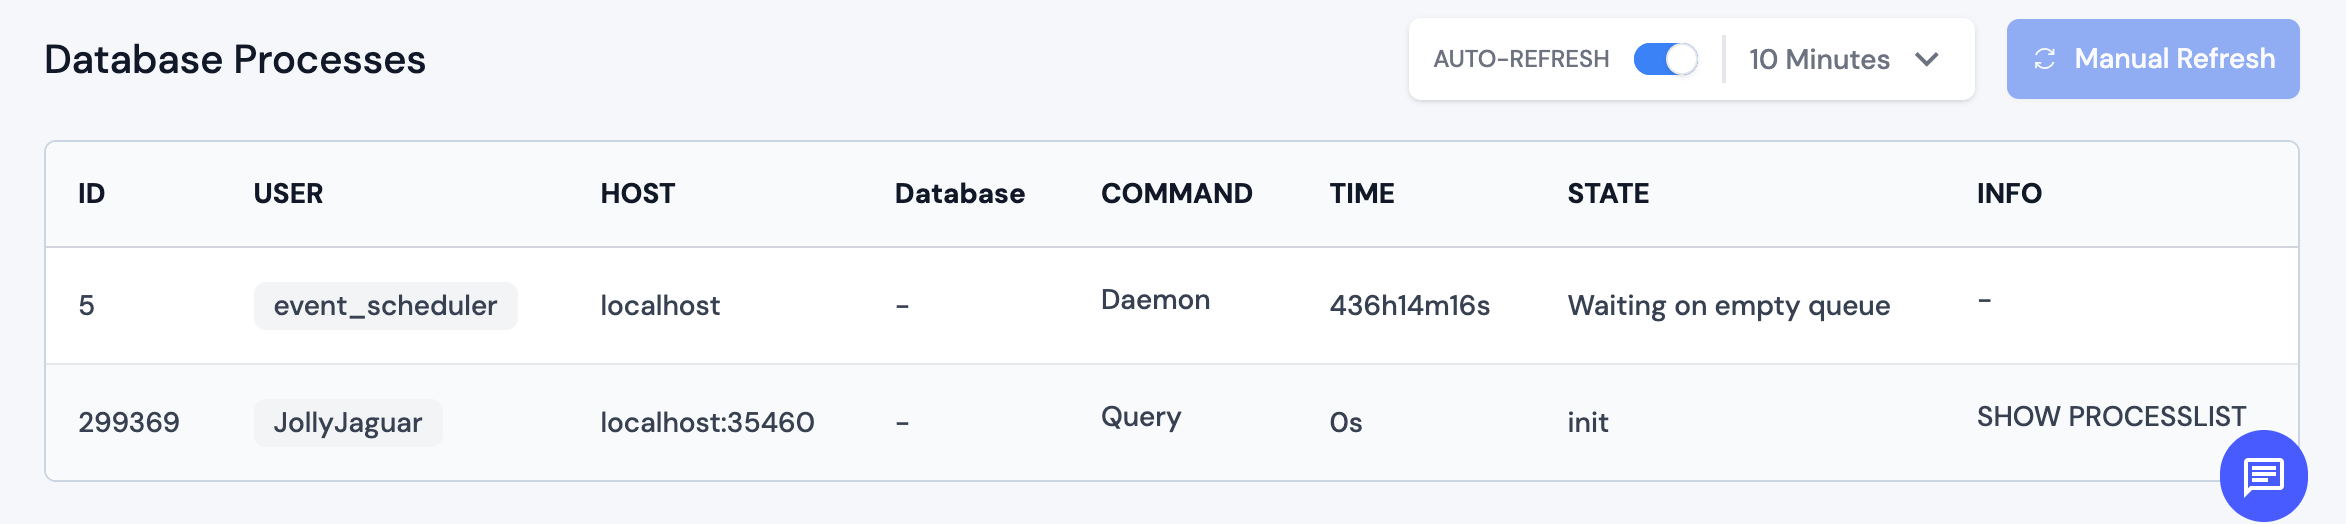
For MySQL and MariaDB databases, the process list displays detailed information about each active database connection and query, including ID, USER, HOST, Database, COMMAND, TIME, STATE, and INFO columns.
MongoDB Process List
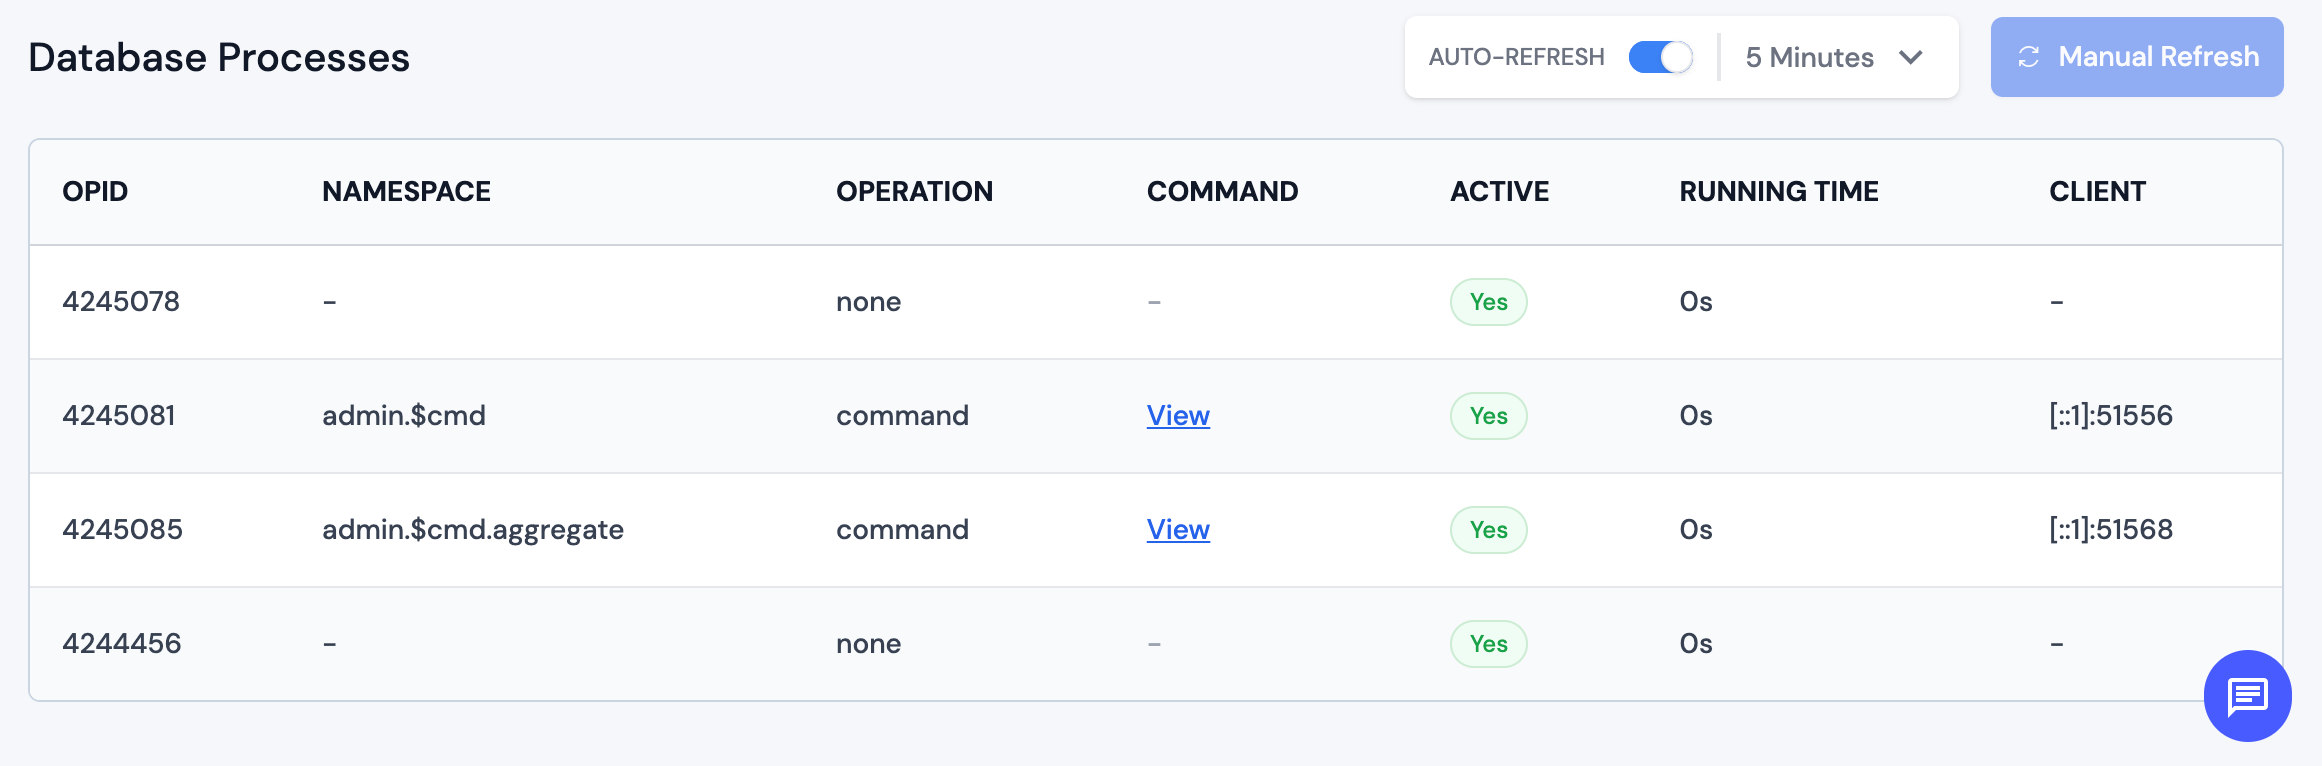
For MongoDB databases, the process list displays information about active operations and connections, including OPID, NAMESPACE, OPERATION, COMMAND, ACTIVE, RUNNING TIME, and CLIENT columns.
Auto-Refresh and Manual Refresh
The Database Process List includes refresh controls to keep the information up-to-date:
- AUTO-REFRESH Toggle: Enable or disable automatic refreshing of the process list
- Refresh Interval: When auto-refresh is enabled, select the refresh interval from the dropdown (options typically include 1 minutes, 2 minutes, 5 minutes etc.)
- Manual Refresh Button: Click to immediately refresh the process list. Note: Auto-refresh must be disabled to use the manual refresh button.
Use Cases
The Database Process List is useful for:
- Performance Monitoring: Identify long-running queries that may be impacting database performance
- Connection Management: Monitor active database connections and identify connection leaks
- Troubleshooting: Investigate slow queries or hung processes
- Security Auditing: Review which users and hosts are accessing the database
- Resource Optimization: Identify processes consuming excessive resources
- Query Analysis: Examine the actual SQL queries or MongoDB commands being executed
Best Practices
- Regularly monitor the Database Process List to identify patterns and potential issues
- Pay attention to processes with long running times, as they may indicate performance problems
- Use the auto-refresh feature to keep the information current during troubleshooting sessions
- Review the process details to understand what operations are being performed
NOTE: The Database Process List provides a snapshot of current database activity. For historical analysis and trend identification, use the Query Monitor chart above the process list. If you notice consistently long-running queries or unusual activity patterns, consider optimizing your database queries or investigating application performance issues.