Server Process List
Overview
The Process List feature allows you to monitor all running processes on your server in real-time. You can view detailed information about each process, including Process ID (PID), User, CPU usage, Memory consumption, and the command being executed. This feature is essential for monitoring server performance, identifying resource-intensive processes, and troubleshooting server issues.
Key Features
- Auto-Refresh: Automatically refresh the process list at configurable intervals
- Manual Refresh: Manually refresh the process list when needed
- Sortable Columns: Sort processes by CPU usage or Memory consumption
- Kill Process: Stop a stuck or runaway process when you know it is safe to do so
- Real-time Monitoring: View up-to-date information about all running processes
Access the Process List
Step 1: Log in to your ServerAvatar account and click the Server Dashboard button.

Step 2: In the Server Panel, click on the "Processes" tab.
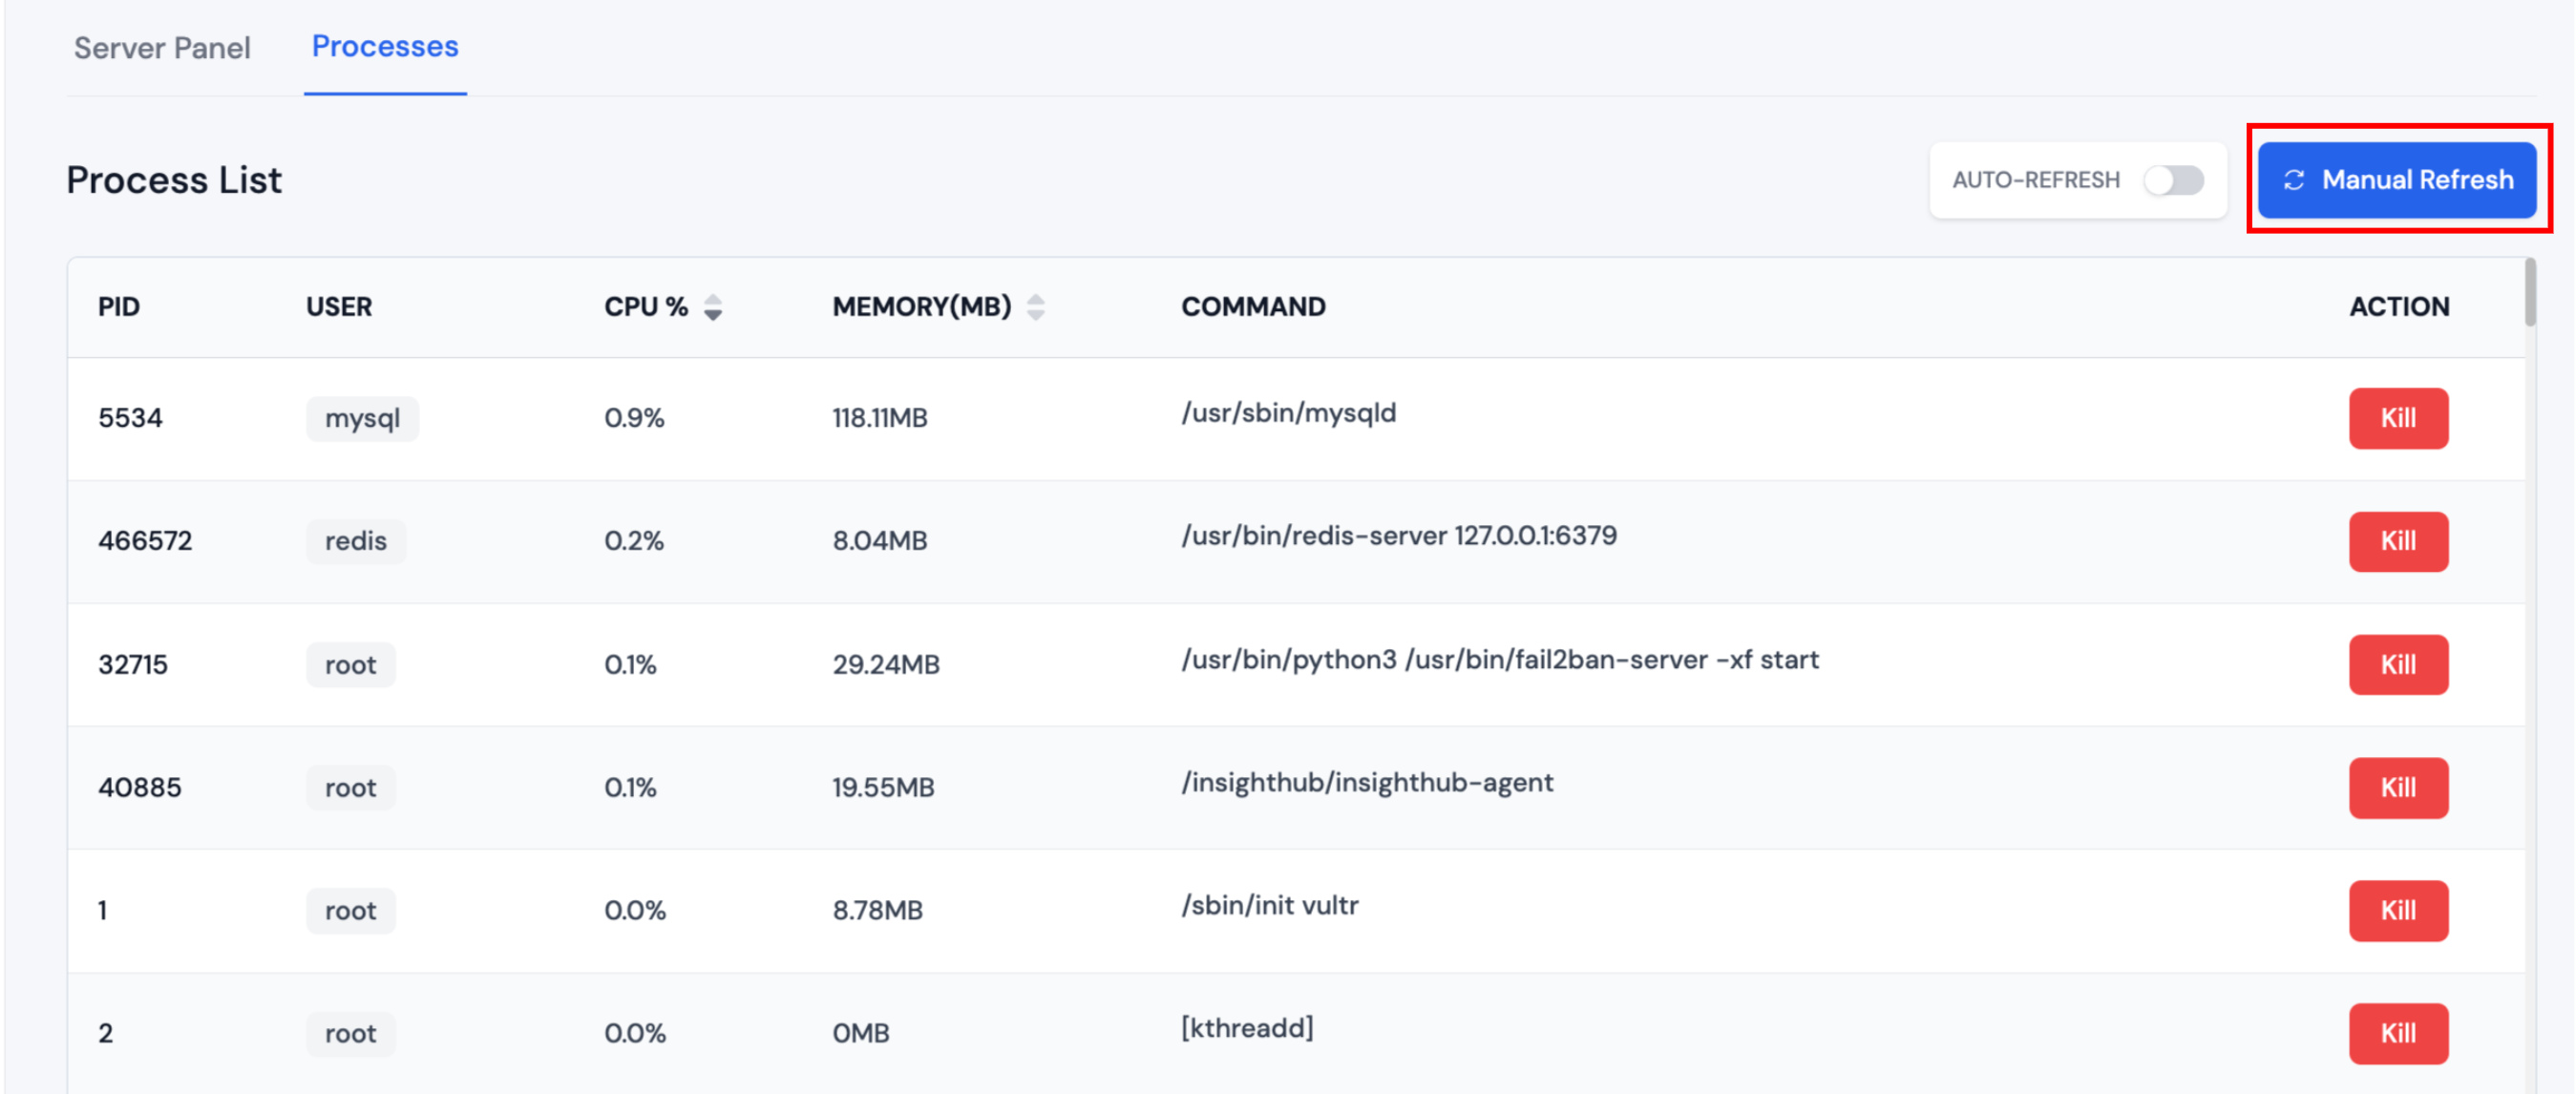
Step 3: The Process List screen will display all running processes on your server.
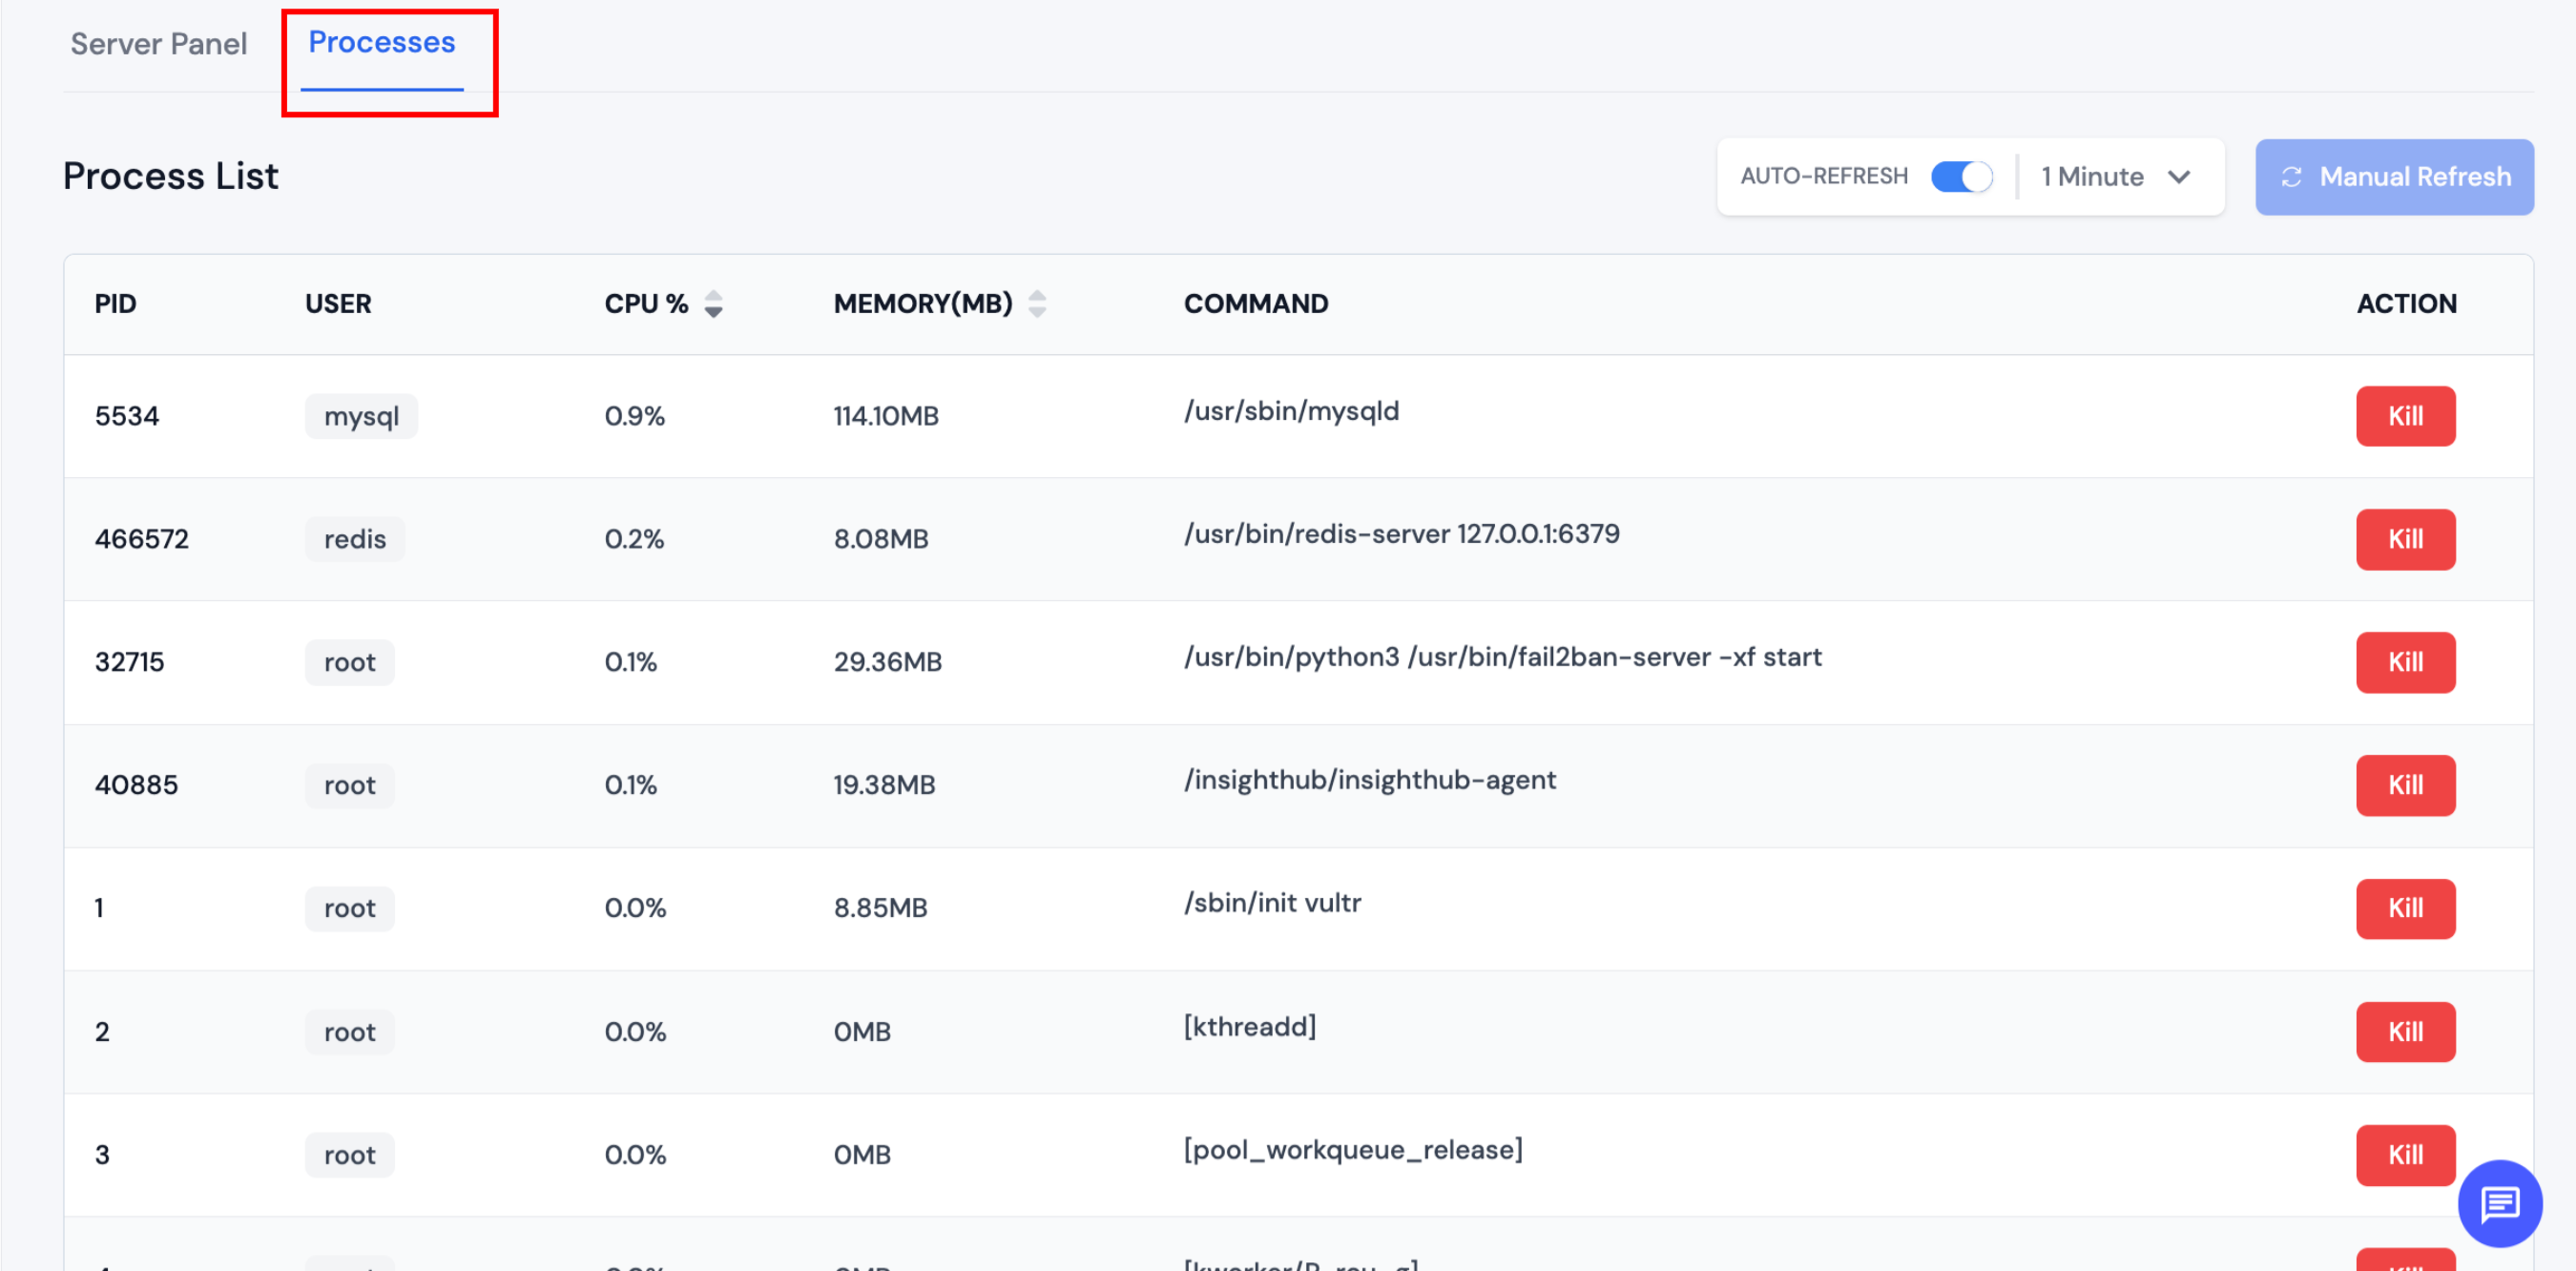
Understanding the Process List
The Process List displays the following information for each running process:
- PID: The unique Process ID assigned to each process
- USER: The user account running the process
- CPU %: The percentage of CPU resources being used by the process
- MEMORY(MB): The amount of memory (in megabytes) consumed by the process
- COMMAND: The command or program being executed
Kill a Process
Use this when a process is stuck, using too many resources, or blocking work you need to do. Killing the wrong process can stop databases, web servers, or other services on the server.
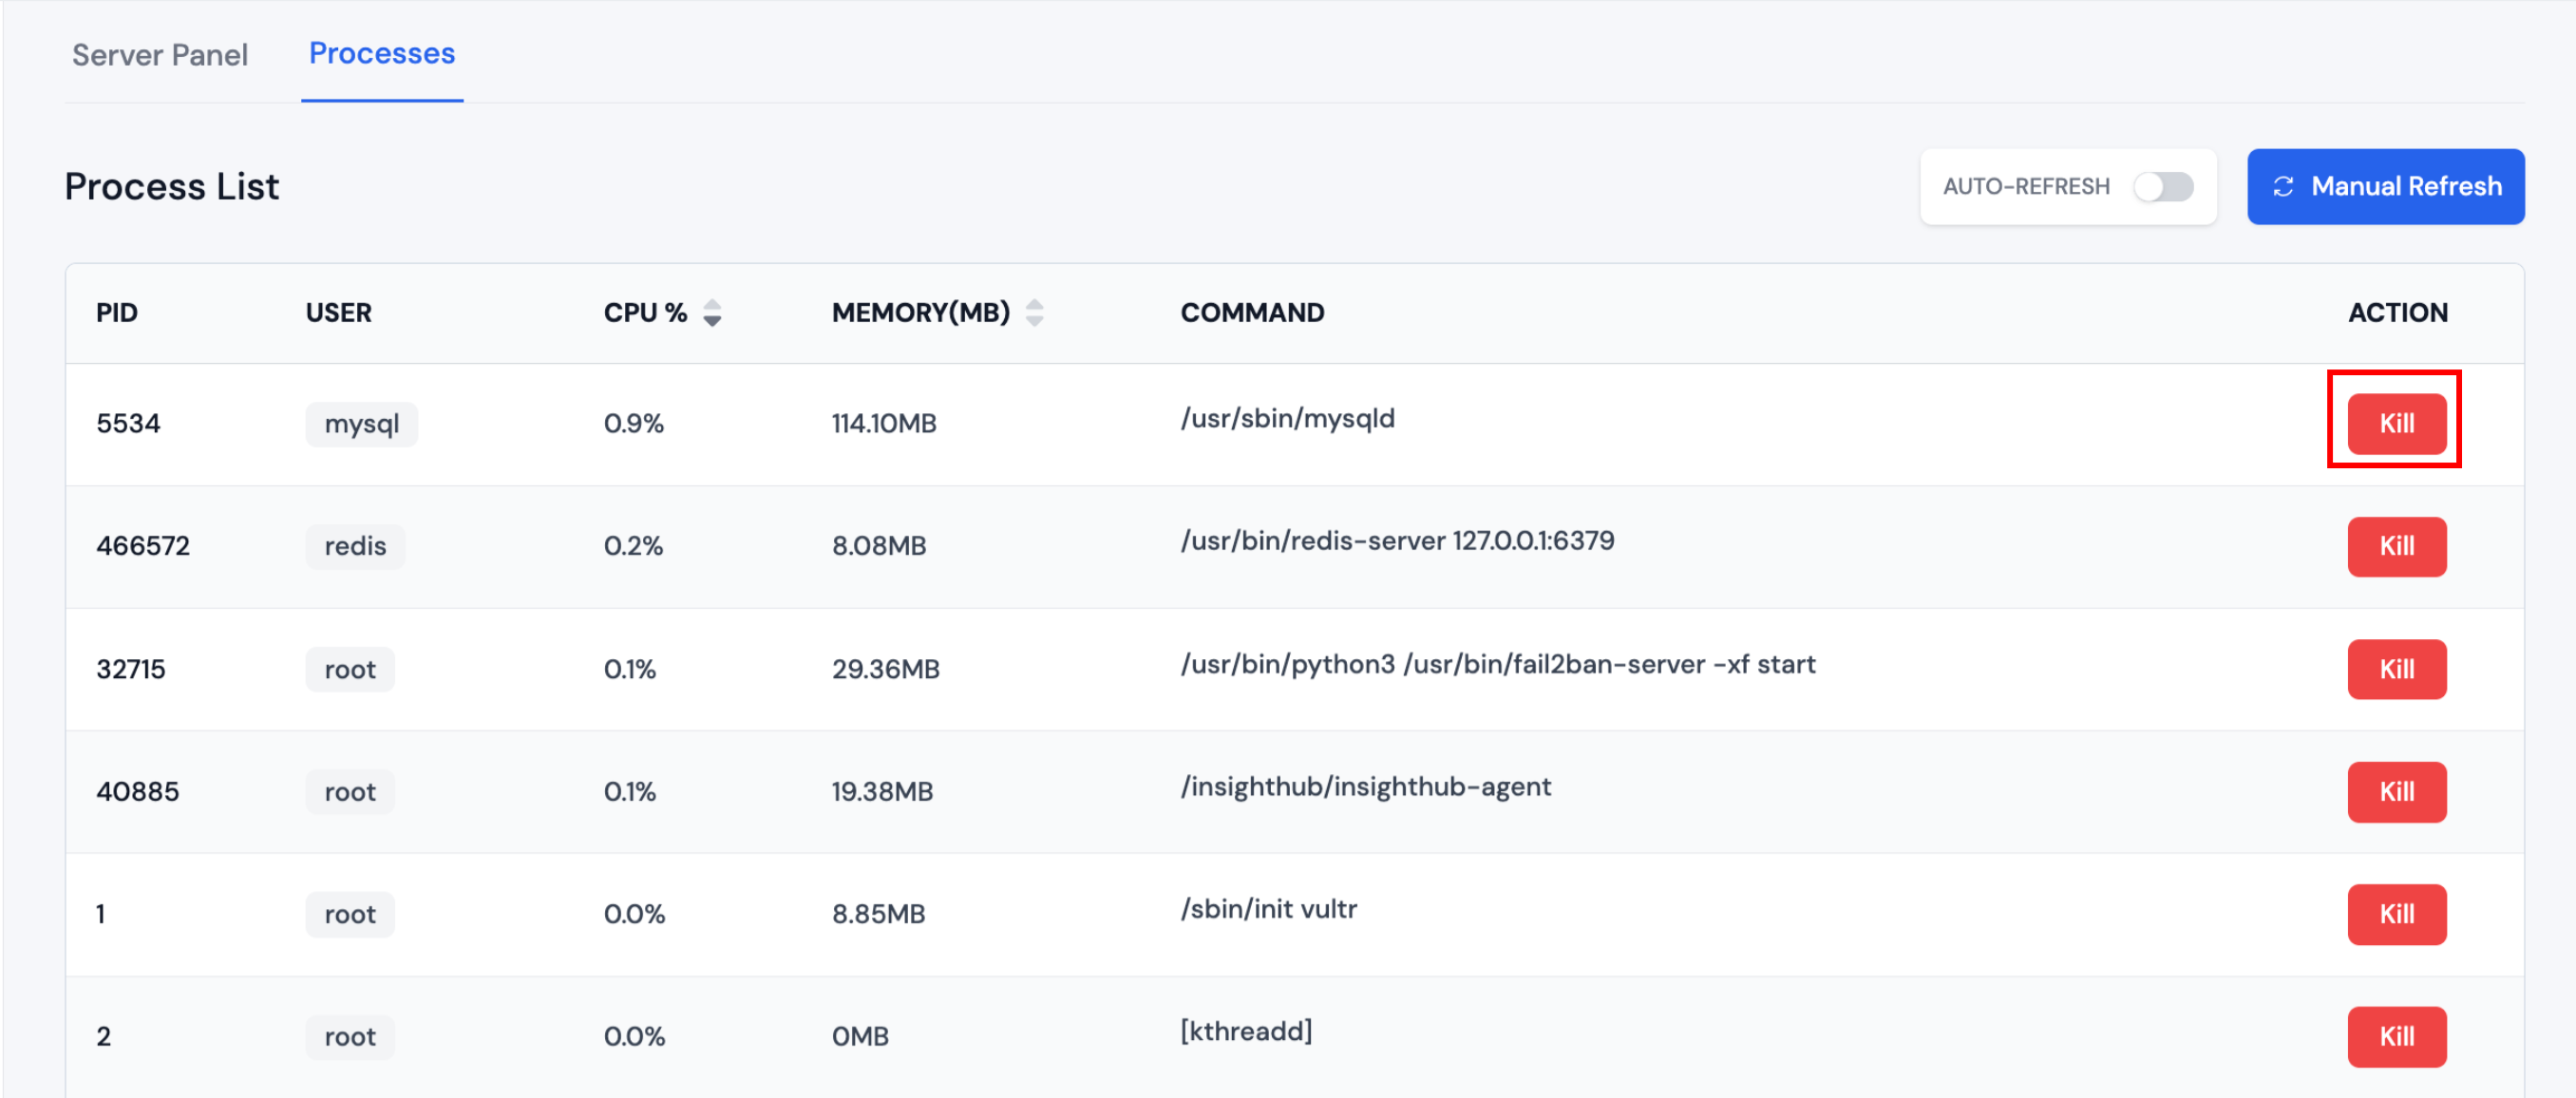
Step 1: Open the Process List and find the process (sort by CPU or memory if needed).
Step 2: Click Kill on that row.
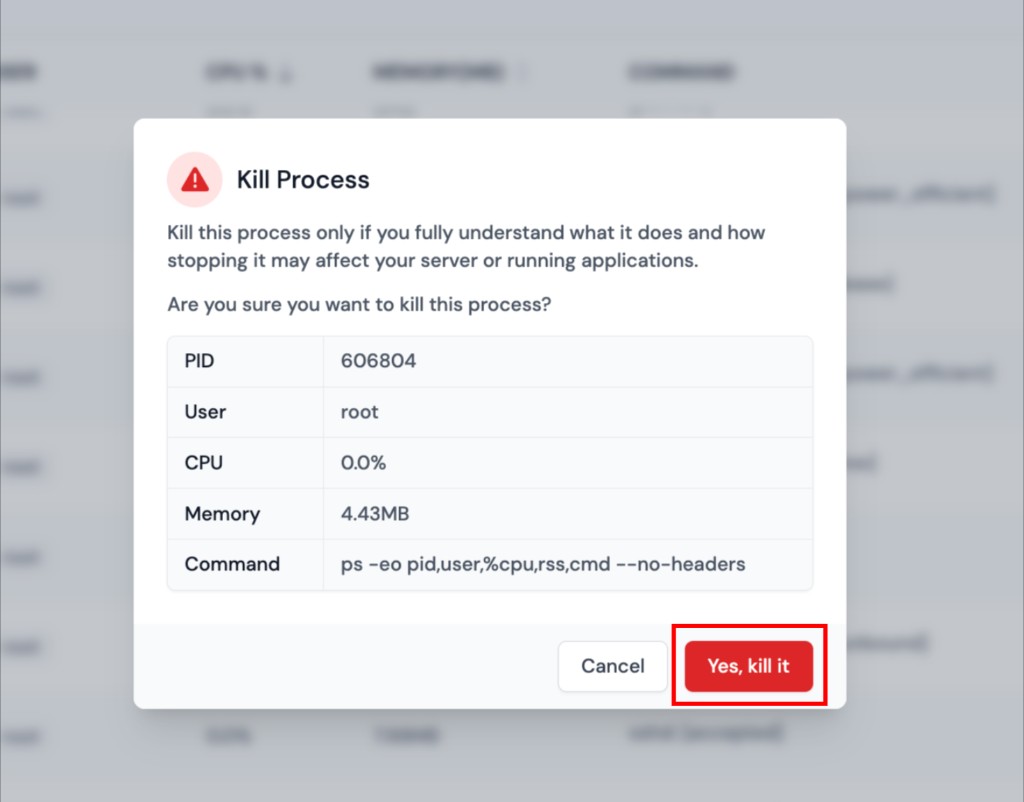
Step 3: Check the process details in the confirmation dialog (PID, user, command). Confirm only if you are sure stopping it will not break a service you still need.
Step 4: Click Yes, kill it to terminate the process, or cancel to leave it running.
Do not kill system services (for example MySQL, Redis, PHP-FPM, or nginx) unless you intend to stop that service and know how to start it again. Critical processes may restart automatically, but your sites can go offline in the meantime.
The list refreshes after a successful kill. If the process returns immediately, it may be managed by a service supervisor that restarted it; fix the underlying issue instead of killing it repeatedly.
Auto-Refresh Process List
You can enable automatic refreshing of the process list to keep the information up-to-date without manual intervention.
Step 1: In the Process List screen, locate the AUTO-REFRESH toggle switch in the top right corner.
Step 2: Toggle the AUTO-REFRESH switch to ON.
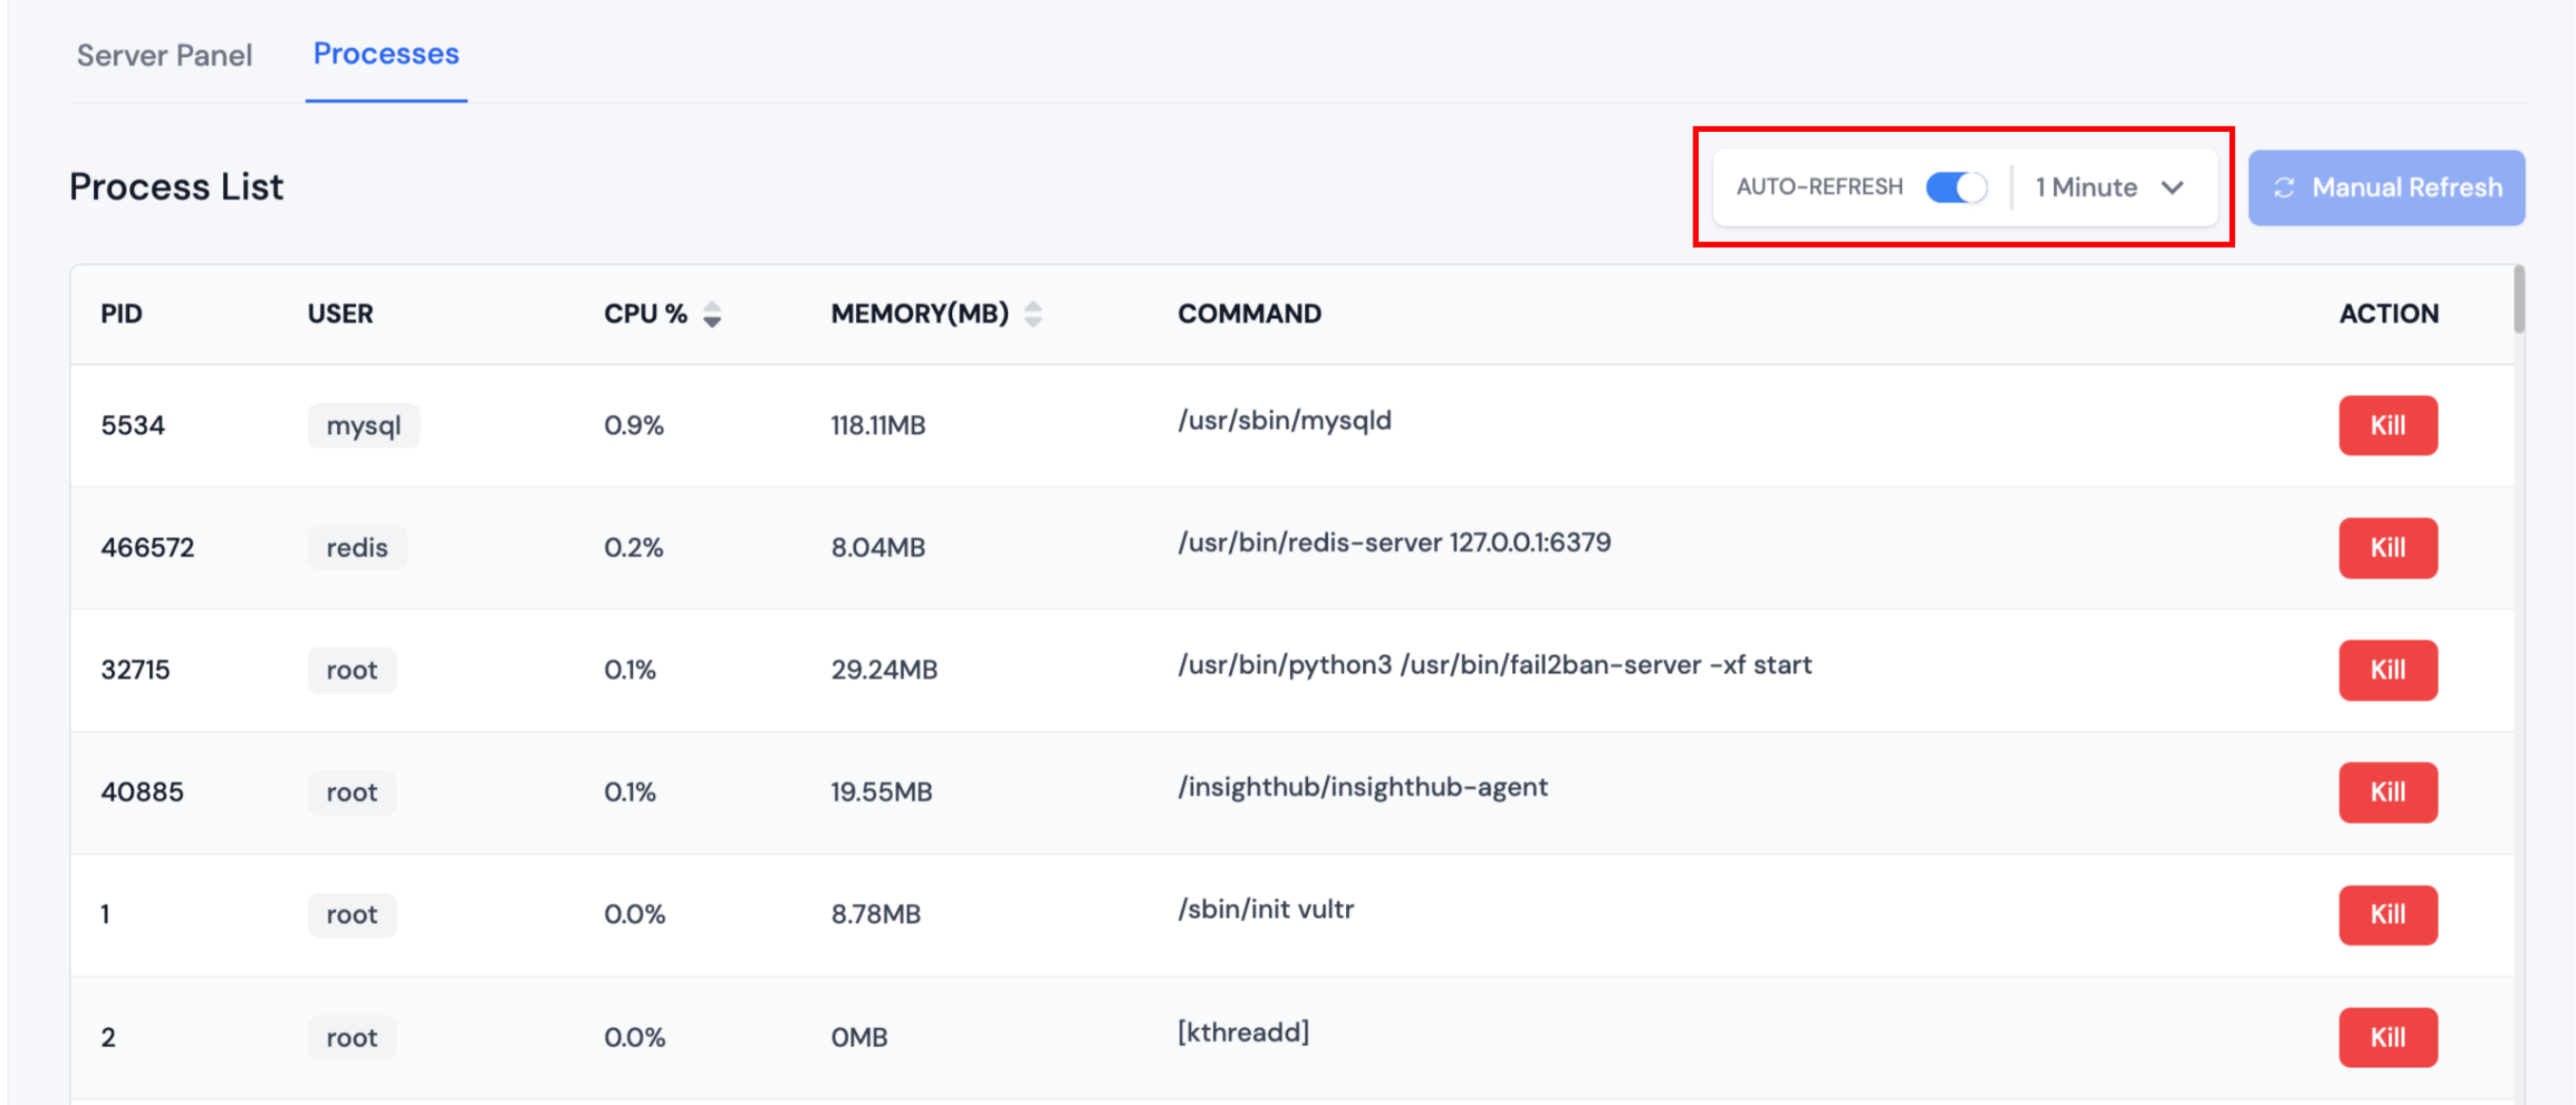
Step 3: Once auto-refresh is enabled, select your desired refresh interval from the dropdown menu next to the toggle. Available intervals include:
- 1 Minute
- 2 Minutes
- 5 Minutes
- 10 Minutes
- 30 Minutes
Step 4: The process list will now automatically refresh at the selected interval.
When auto-refresh is enabled, the Manual Refresh button will be disabled to prevent conflicts.
Manual Refresh
If auto-refresh is disabled, you can manually refresh the process list at any time.
Step 1: Ensure that AUTO-REFRESH is toggled OFF.
Step 2: Click the Manual Refresh button (with the refresh icon) to update the process list immediately.
The process list will refresh and display the current state of all running processes.
Sort Processes
You can sort the process list by CPU usage or Memory consumption to quickly identify resource-intensive processes.
Sort by CPU Usage
Step 1: Click on the CPU % column header.
Step 2: Click again to toggle between ascending and descending order.
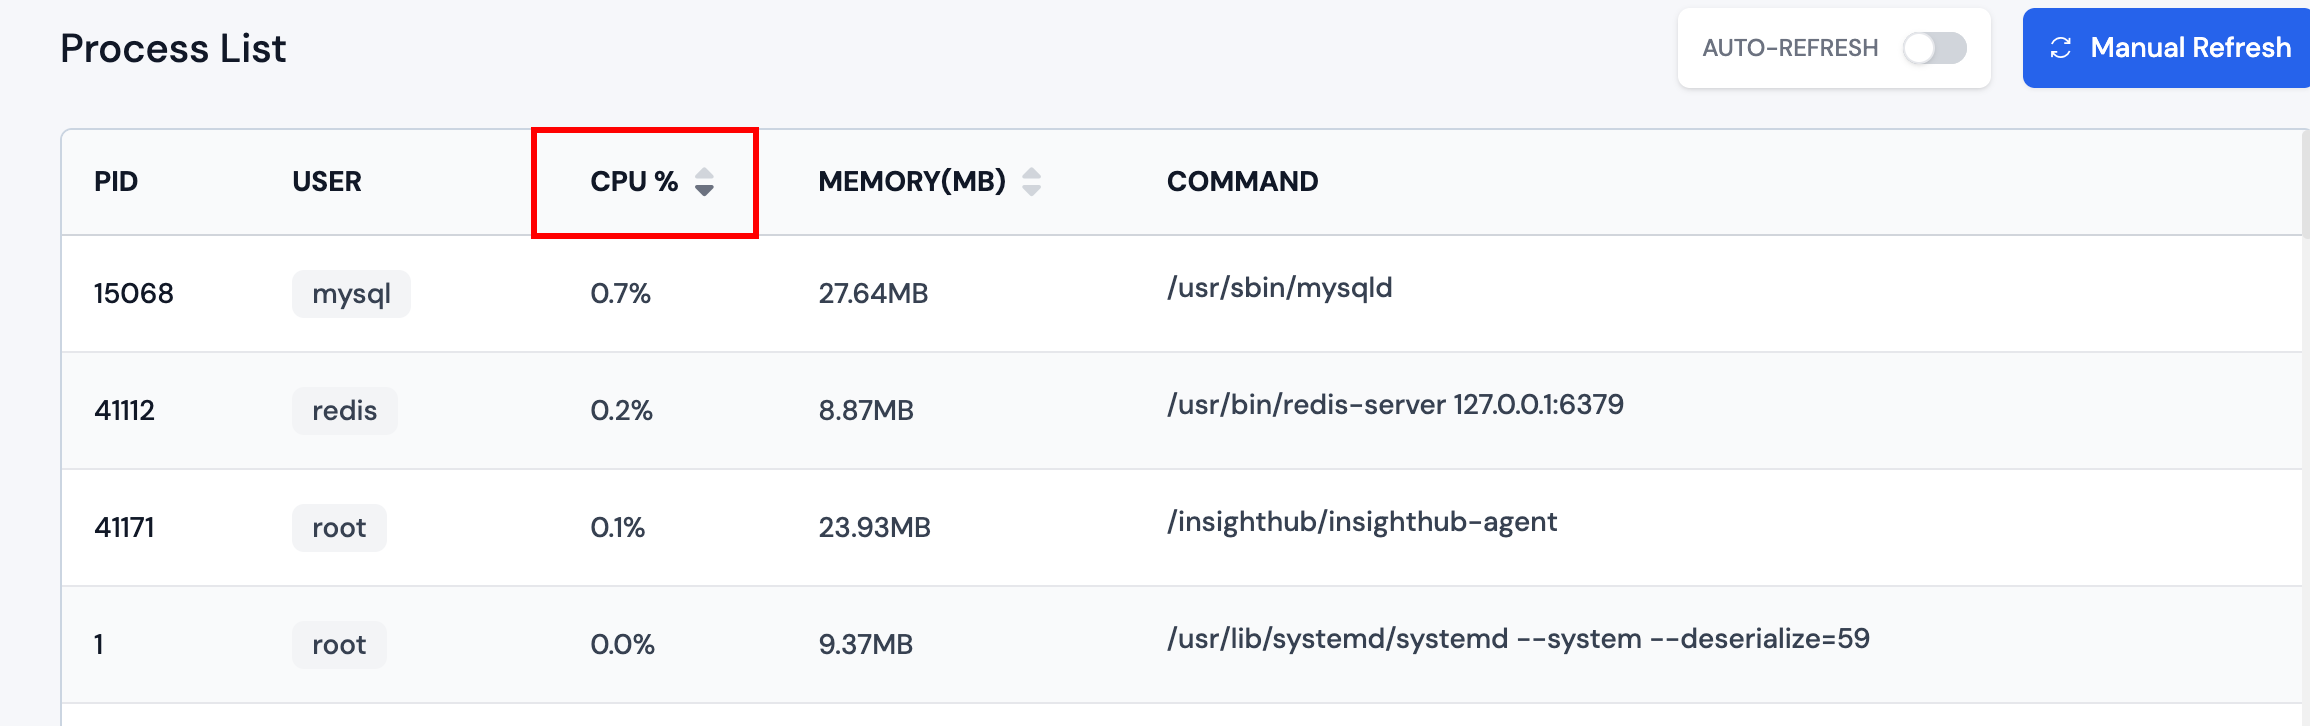
The processes will be sorted by their CPU usage percentage, helping you identify which processes are consuming the most CPU resources.
Sort by Memory Usage
Step 1: Click on the MEMORY(MB) column header.
Step 2: Click again to toggle between ascending and descending order.
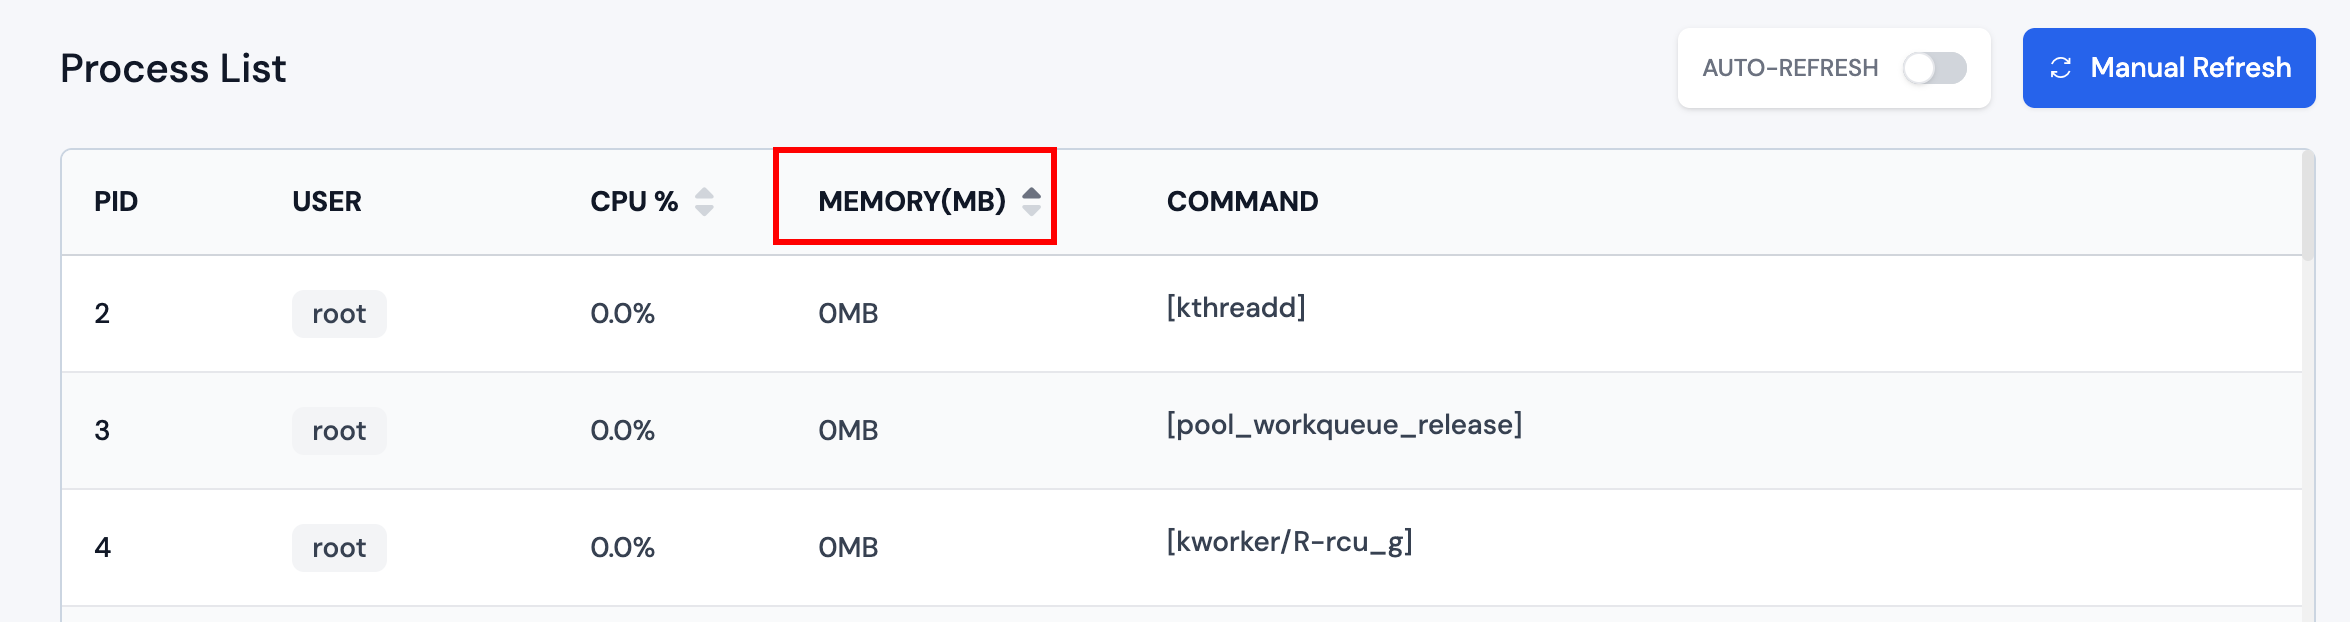
The processes will be sorted by their memory consumption, allowing you to quickly identify memory-intensive processes.