Disk I/O Monitor
The Disk I/O Monitor in the server panel provides real time insights into your server's disk input/output operations. This feature helps you monitor both read and write operations on your server's storage, tracking data transfer rates in Megabytes per second (MB/s). By continuously monitoring disk I/O, you can identify storage performance bottlenecks, detect unusual disk activity, optimize application performance, and ensure your server's storage subsystem meets your application's requirements. This comprehensive monitoring capability is essential for maintaining optimal disk performance and troubleshooting storage-related issues.
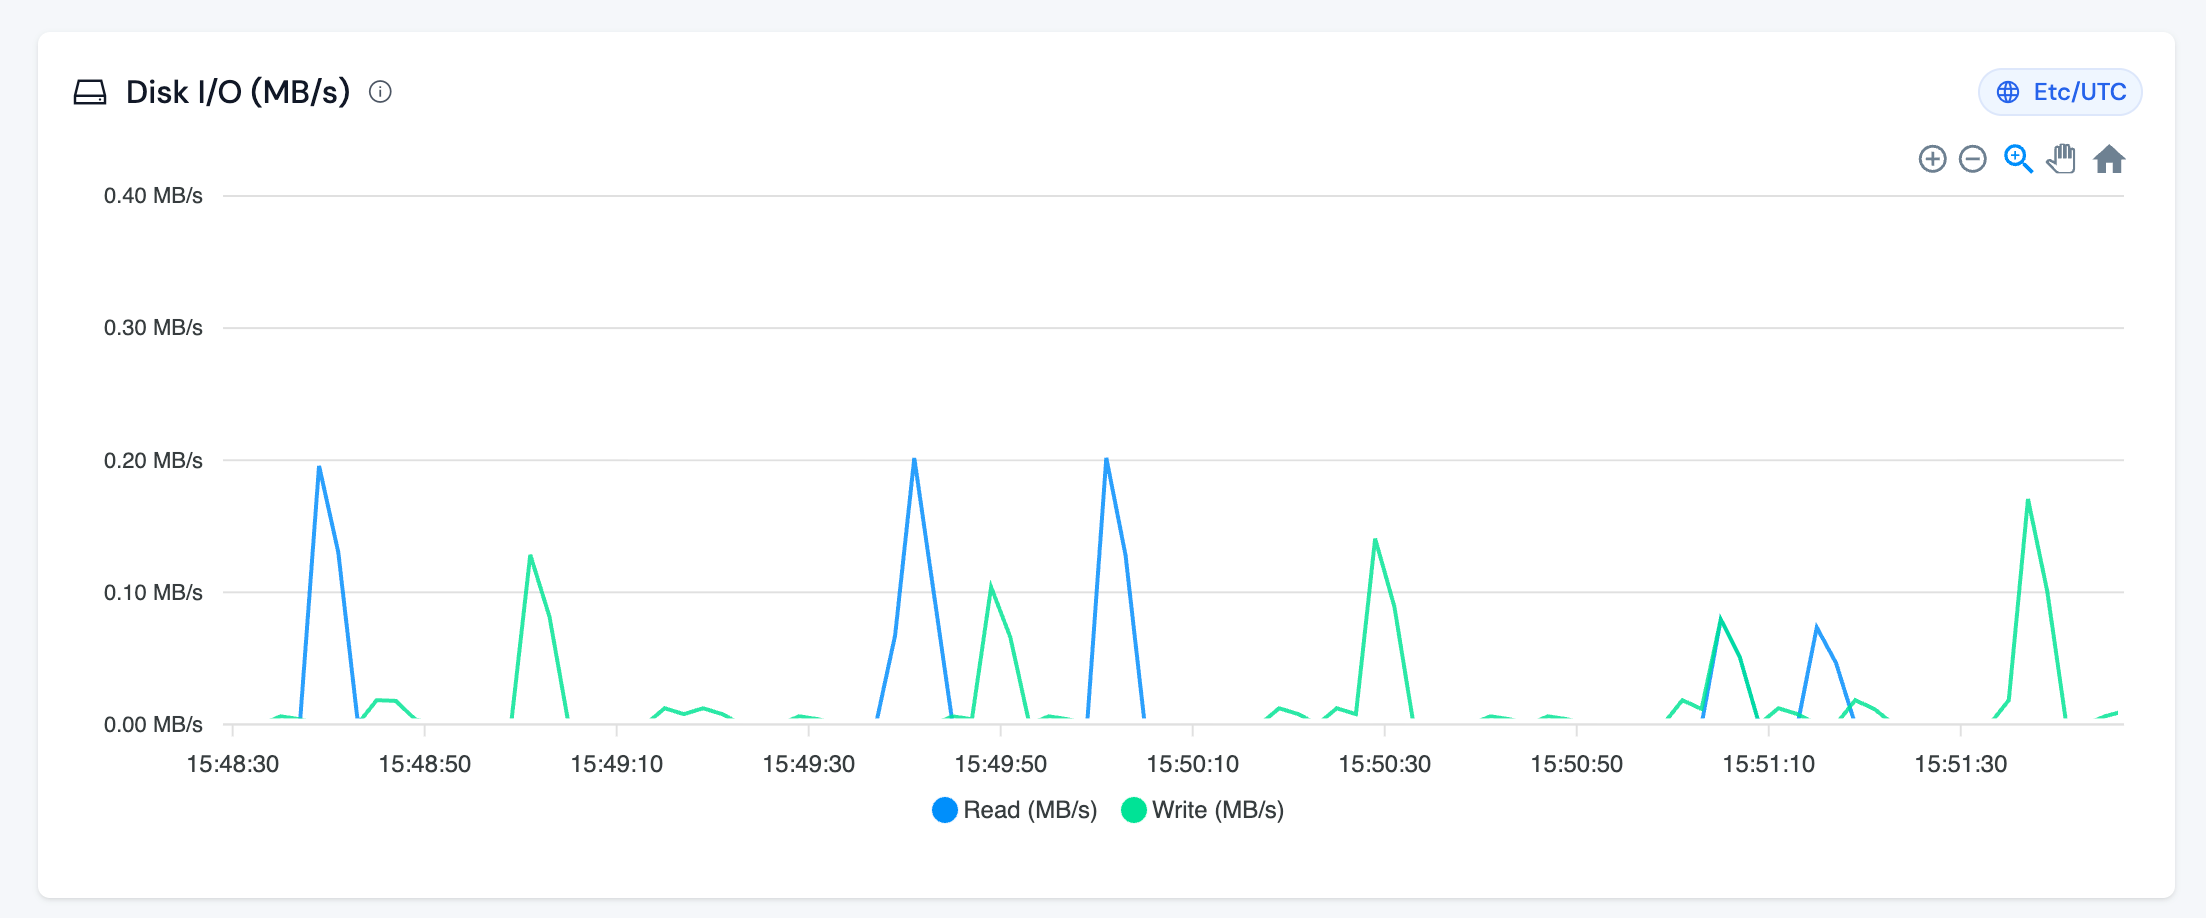
The example given below is from one of the servers in ServerAvatar's network.
The Disk I/O Monitor tracks the following metrics:
-
Read (MB/s): This metric represents the amount of data being read from the disk storage, measured in Megabytes per second. Read operations occur when your server retrieves data from storage, such as:
- Loading application files and scripts
- Reading database records
- Serving static files (images, CSS, JavaScript)
- Accessing configuration files
- Reading log files
- Loading cached data
-
Write (MB/s): This metric represents the amount of data being written to the disk storage, measured in Megabytes per second. Write operations occur when your server saves data to storage, such as:
- Saving database records and updates
- Writing log files
- Uploading files
- Creating temporary files
- Updating cache files
- Writing application generated content
Interpreting Disk I/O Patterns
Normal Patterns:
- Intermittent spikes during application operations (database queries, file operations) are normal
- Read operations typically occur more frequently than write operations for most web applications
- Periods of low or zero activity between operations indicate efficient disk usage
- Spikes during scheduled tasks (backups, cron jobs, updates) are expected
Concerning Patterns:
- Sustained high disk I/O that approaches your disk's performance limits
- Continuous high read operations may indicate inefficient caching or excessive file access
- Continuous high write operations may suggest excessive logging, large file uploads, or database write issues
- Simultaneous high read and write operations can cause disk contention and slow down both operations
- Unusually frequent spikes may indicate application performance issues or resource intensive operations
Disk I/O and Application Performance
Disk I/O directly impacts your application's performance:
- High Read I/O: If your application frequently reads from disk, consider implementing caching mechanisms (Redis, Memcached) to reduce disk reads
- High Write I/O: Excessive writes can slow down your application. Optimize logging, implement write buffering, or consider using faster storage solutions
- Disk Contention: When both read and write operations are high simultaneously, your disk may become a bottleneck, affecting overall server performance
NOTE: Consistently high disk I/O can significantly impact your server's performance and response times. Monitor these metrics alongside CPU, memory, and network usage to maintain optimal server performance. If disk I/O remains consistently high, it may indicate the need for application optimization or storage upgrade.