Network I/O Monitor
The Network I/O Monitor in the server panel provides real time insights into your server's network traffic patterns. This feature helps you monitor both public and private network interfaces, tracking incoming and outgoing data transfers in Megabytes per second (MB/s). By continuously monitoring network I/O, you can identify bandwidth usage patterns, detect unusual network activity, optimize resource allocation, and ensure your server's network performance meets your application's requirements. This comprehensive monitoring capability is essential for maintaining optimal network performance and troubleshooting connectivity issues.
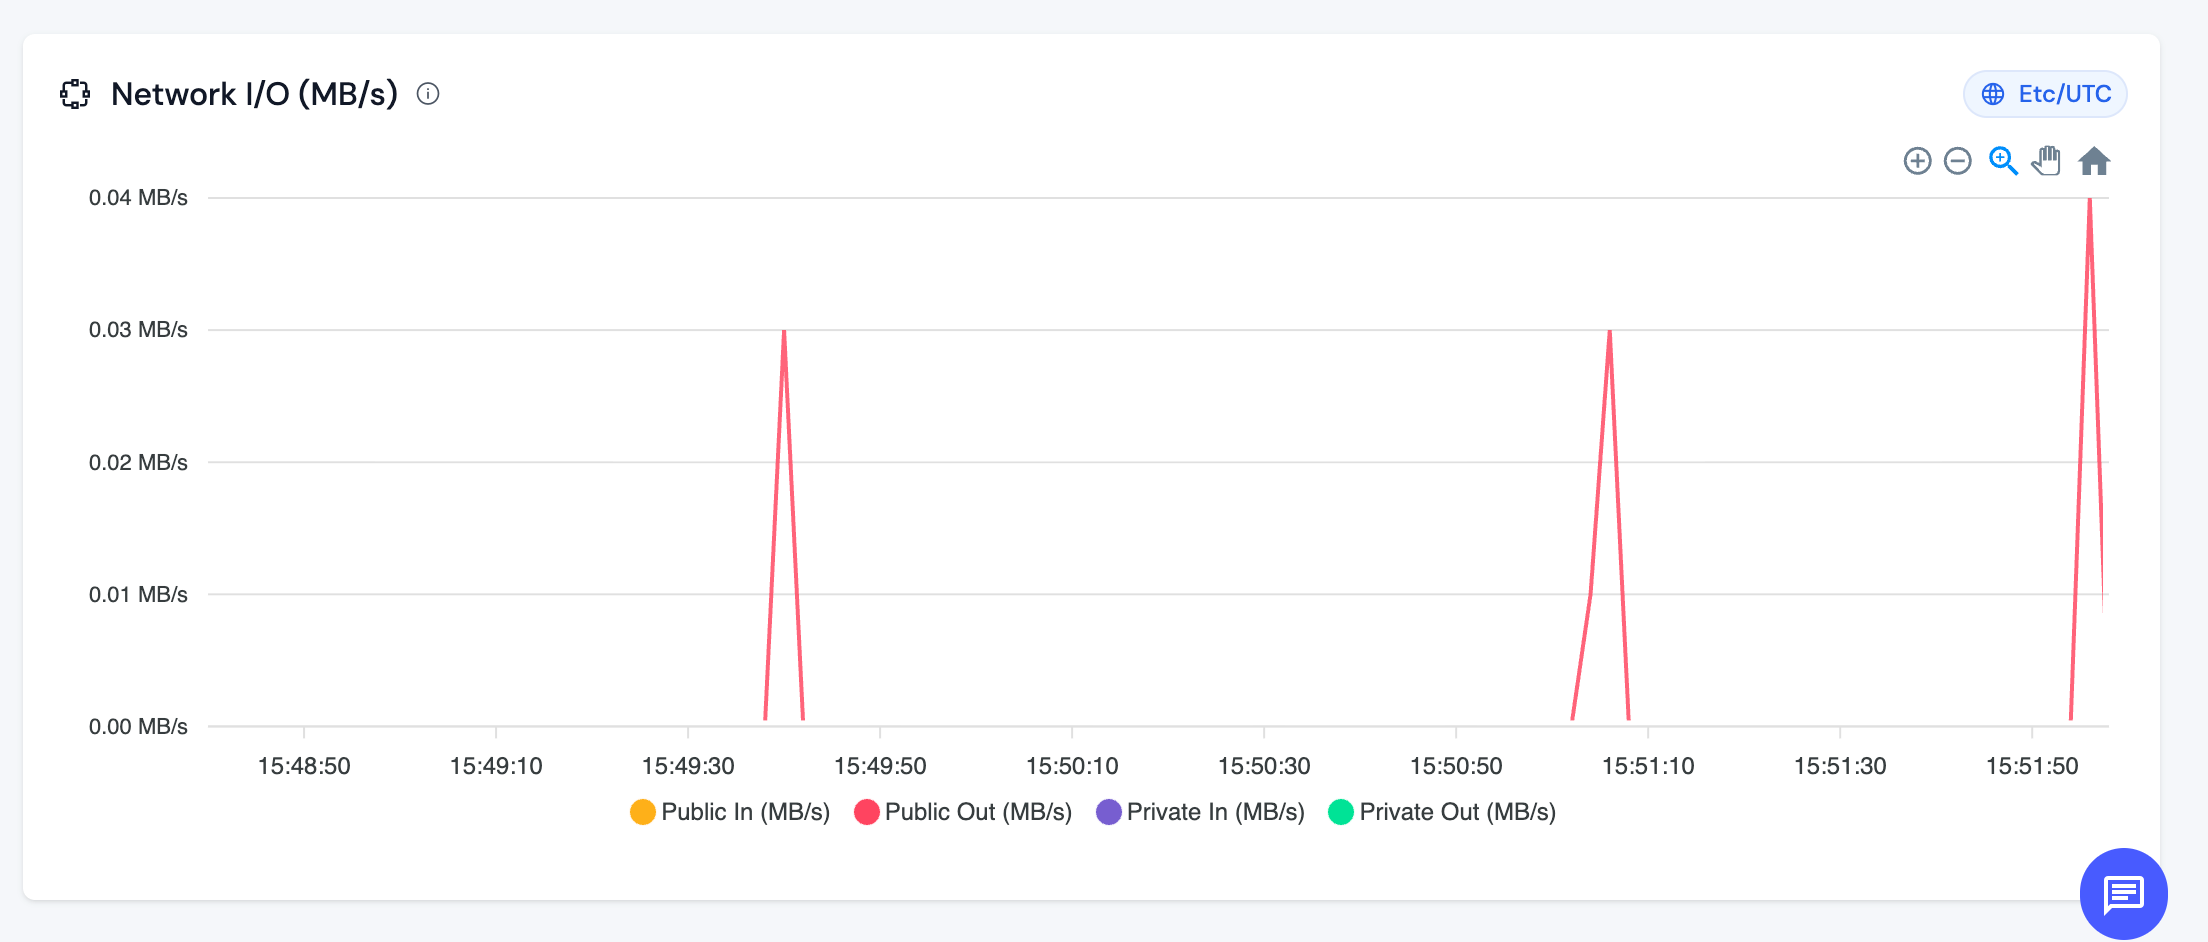
The example given below is from one of the servers in ServerAvatar's network.
The Network I/O Monitor tracks the following metrics:
-
Public In (MB/s): This metric represents the amount of data being received from the public internet to your server, measured in Megabytes per second. It includes all incoming traffic from external sources such as website visitors, API requests, file uploads, and other public facing communications.
-
Public Out (MB/s): This metric represents the amount of data being sent from your server to the public internet, measured in Megabytes per second. It includes all outgoing traffic such as responses to website visitors, API responses, file downloads, email sending, and other public facing communications.
-
Private In (MB/s): This metric represents the amount of data being received through private network interfaces, measured in Megabytes per second. Private network traffic typically includes internal communications between servers, database replication, internal API calls, and other private network operations that don't traverse the public internet.
-
Private Out (MB/s): This metric represents the amount of data being sent through private network interfaces, measured in Megabytes per second. This includes internal server-to-server communications, database synchronization, internal service calls, and other private network operations.
Interpreting Network I/O Patterns
Normal Patterns:
- Consistent, predictable traffic patterns indicate stable application behavior
- Spikes during peak usage hours are normal for applications with scheduled activities
- Low or zero activity during off peak hours is expected for most applications
Concerning Patterns:
- Sustained high network I/O that approaches your server's bandwidth limits
- Unexpected spikes that don't correlate with known application activities
- Continuous high Public Out traffic may indicate data exfiltration or excessive outbound connections
- Unusually high Private In/Out traffic might suggest internal network issues or misconfigured services
NOTE: Consistently high network I/O, especially Public Out traffic, can impact your server's performance and may indicate the need for bandwidth optimization or server upgrade. Monitor these metrics alongside other server resources to maintain optimal performance.