Server Health Monitor
Server health monitoring is an important feature that helps you to determine the time to upgrade or downgrade the server. It also helps you to understand if there are any unusual activities happening on your server. By continuously assessing server health metrics such as Server Load, Memory utilization, disk usage, you can proactively identify potential issues before they escalate. Additionally, monitoring helps in optimizing resource allocation and ensuring the stability and reliability of your server environment. Overall, robust server health monitoring is indispensable for effective server management and ensuring seamless operations.
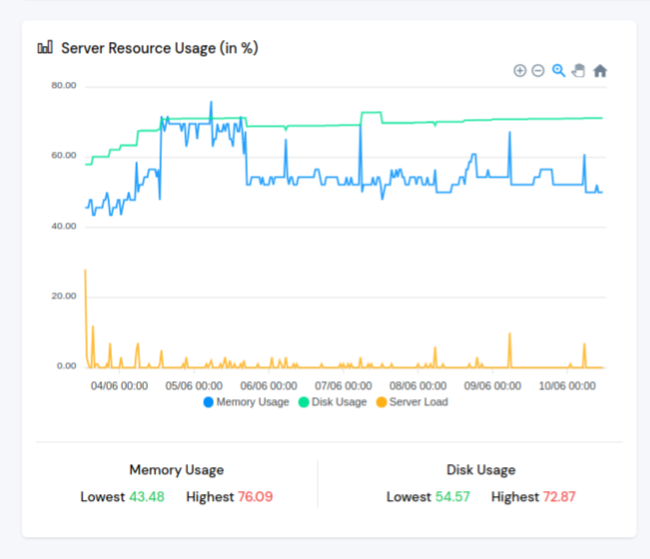
The example given below is from one of the servers in ServerAvatar's network.

The server health monitor keeps track of the following metrics:
- Server Load - 15 Min average (in %): 15 Min average (in %): This metric represents the average system load over the past 15 minutes, expressed as a percentage. It indicates the level of demand on the server's CPU processing capacity.
- Memory Usage: This refers to the proportion of available memory that is currently being utilized by the system. It provides insights into how efficiently the server is managing its memory resources.
- Disk Usage: Disk usage denotes the amount of storage space consumed on the server's disk drives. It indicates the extent to which disk storage is being utilized and can help in managing storage capacity and performance.
To view the server health monitor, go to the Server Panel and find the chart titled "Server Resource Usage".
NOTE: Any value exceeding 100% on this chart will cause server issues. Ensure all values remain below 100%.