Dashboard
The Dashboard section offers a comprehensive overview of each server connected to ServerAvatar and their associated applications, displayed in both chart and tabular formats.
Step 1: First, log in to the InsightHub panel, Click on the Dashboard option.
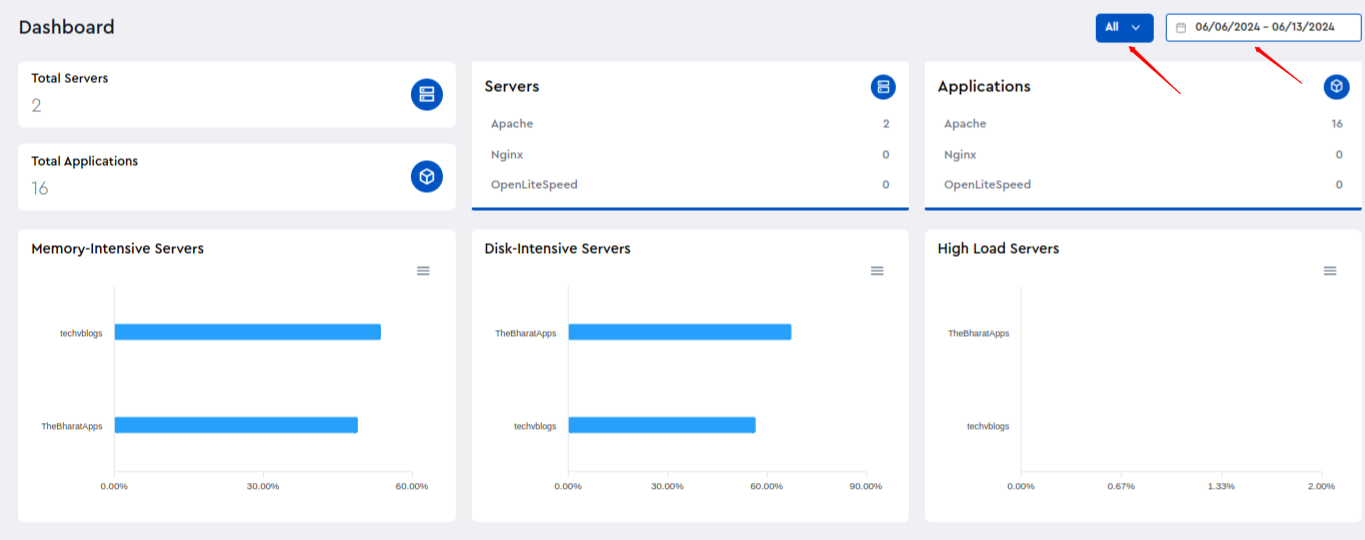
Step 2: You can see the Dashboard of Servers like below.
- You can see detailed information including the total number of connected servers, total applications, web server-based applications, and server configurations. Additionally, charts display memory usage, disk usage, and server load for each server. This panel enables you to filter and search for specific data by selecting a date range in date filters for the data you want to review. By default, you can view the traffic data from both bots and visitors to your application, also you have the option to filter it based on bot activity and visitor interactions.
Step 3: Dashboard Overview:
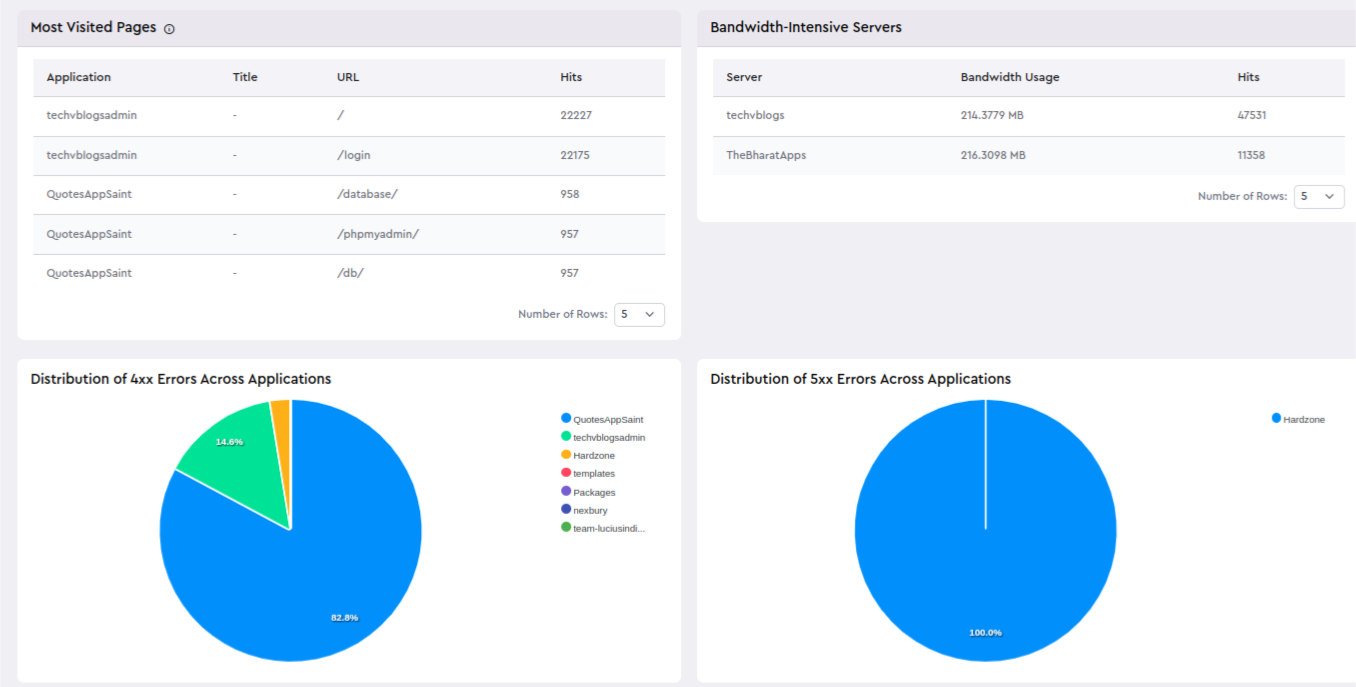
- You can view data on the most visited pages, including information such as the application name, URL, and number of hits. There is also a section for bandwidth-intensive servers, displaying bandwidth usage and the total number of hits for each server. Additionally, you can see a chart showing the distribution of 4xx and 5xx errors across applications.
Step 4: Sitemap URL and File Type Usage Breakdown:
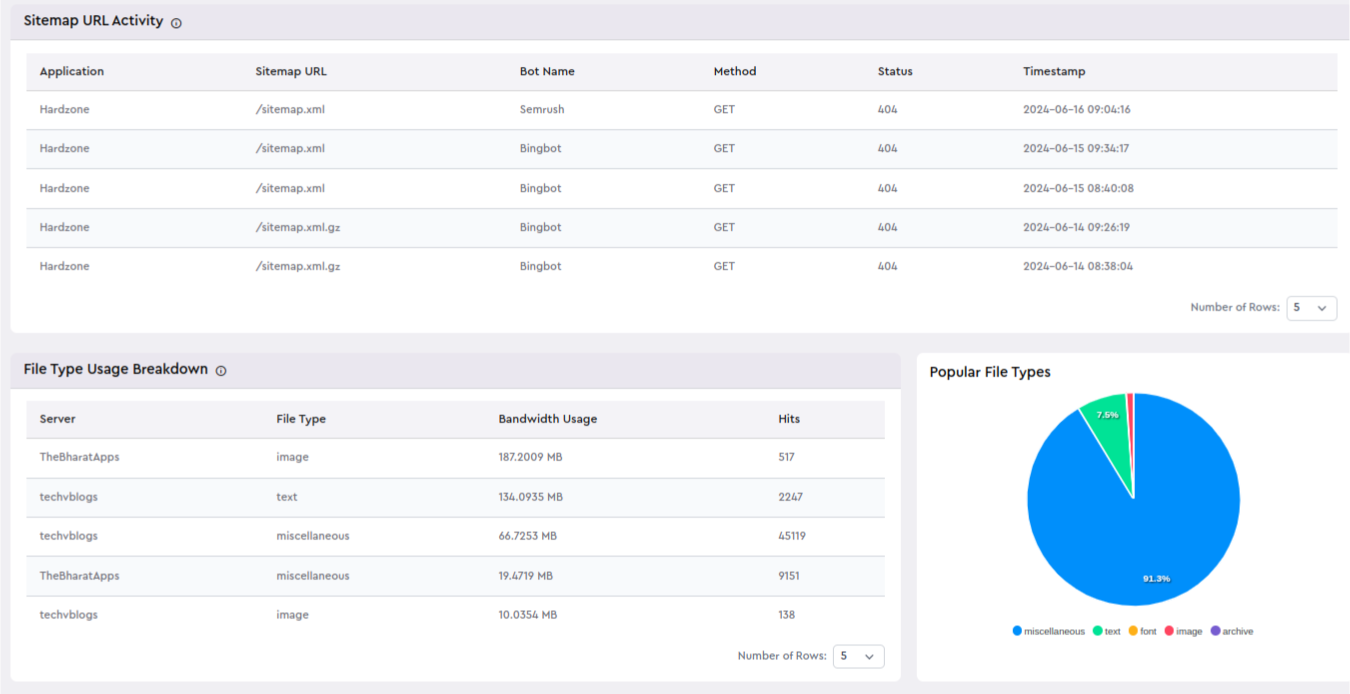
- You can monitor sitemap URL activity, including details such as the application name, sitemap URL, bot name, method, status, and timestamp. Additionally, you can review server name, file type, bandwidth usage, and hits in a tabular file type usage breakdown. Popular file types are also displayed in a graphical format, providing a clear overview of usage patterns.
Step 5: High Bandwidth Usage URLs:
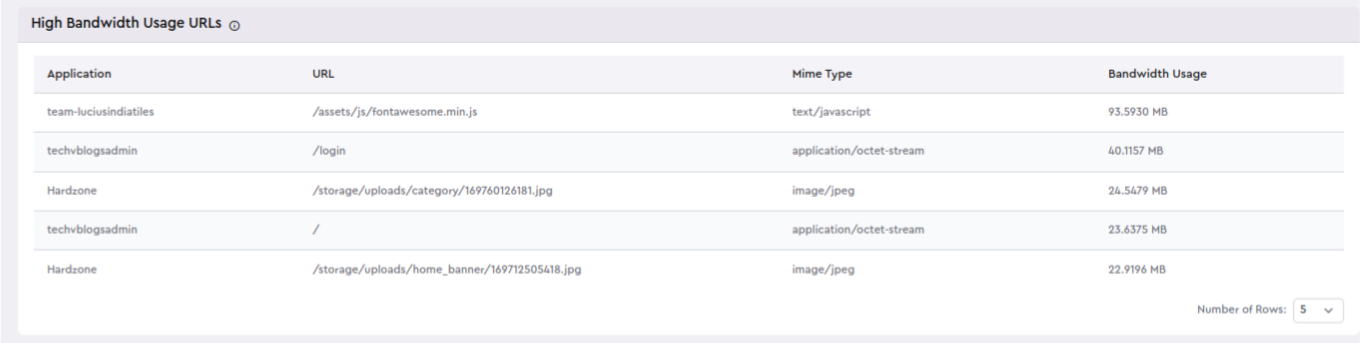
- You can view and analyze data for high bandwidth usage URLs, including details such as application name, URL, MIME type, and bandwidth usage. This information helps identify and manage the most bandwidth-intensive resources.