Server Dashboard
The Server Dashboard section provides a detailed overview of each server connected to ServerAvatar, displayed in a clear tabular format. This panel allows you to filter and search for specific servers easily, enabling efficient management and monitoring. Each entry in the table includes detailed information such as the server name, its IP address, status, web server details, and operating system. This organized layout ensures that you can quickly access and analyze the data needed for effective server management. By utilizing the filtering and search capabilities, you can focus on particular servers.
Step 1: First, log in to the InsightHub panel, Click on the Servers option.
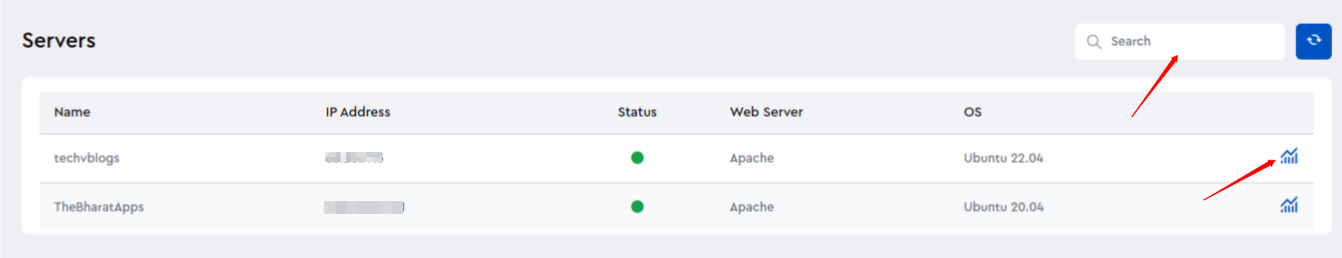
Step 2: You can see the Dashboard of Servers like below.
You can see details like Server Name, IP address, Status, Webserver, Operating System. You can search for specific server by name using the search option.
Click on the graph icon next to any server to check an in-depth view of that particular server. This will take you to the server overview page, where you can see and check all the details about the specific server.
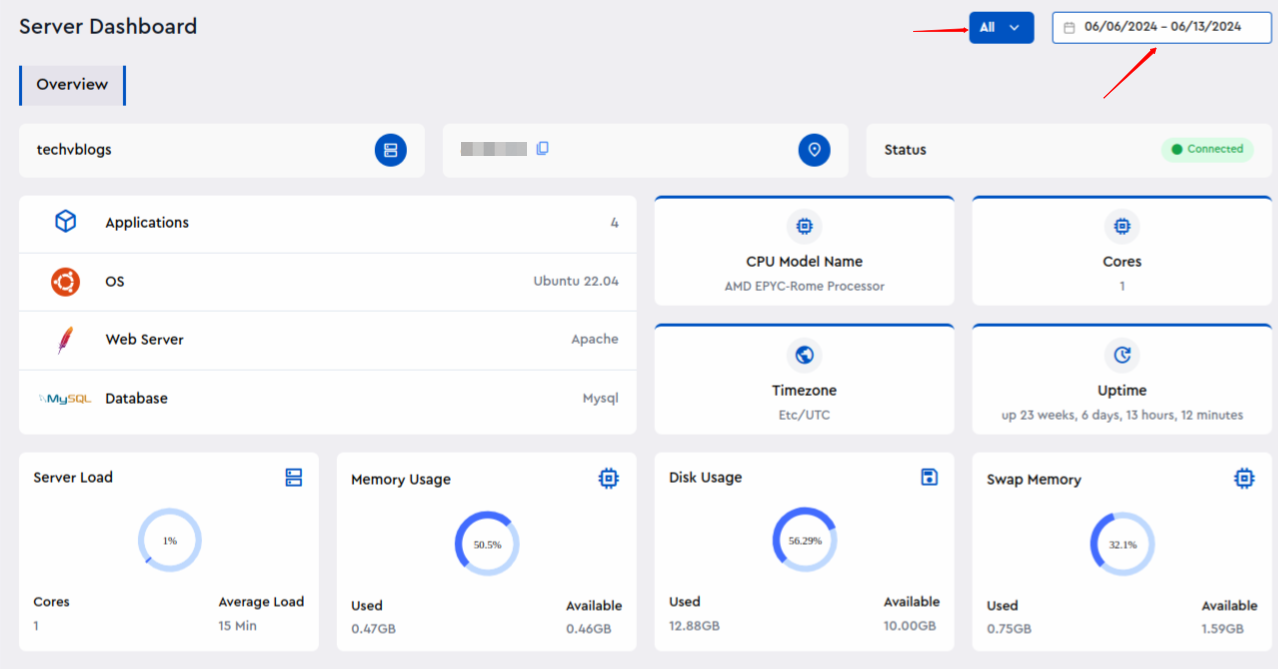
Step 3: Clicking on the graph icon will display the Server overview page for the specific server, as shown below.
You can filter this data by selecting a specific date or a date range. By default, you can view the traffic data from both bots and visitors to your application, also you have the option to filter it based on bot activity and visitor interactions.
You can view the server overview, including details such as Web Server, Database, Number of Applications, Operating System, Status, IP Address. You can see additional information about Server like CPU Model Name, Cores, Timezone, Uptime, Server Load, Memory Usage, Disk Usage, Swap Memory.
Step 4: Resource Utilization:
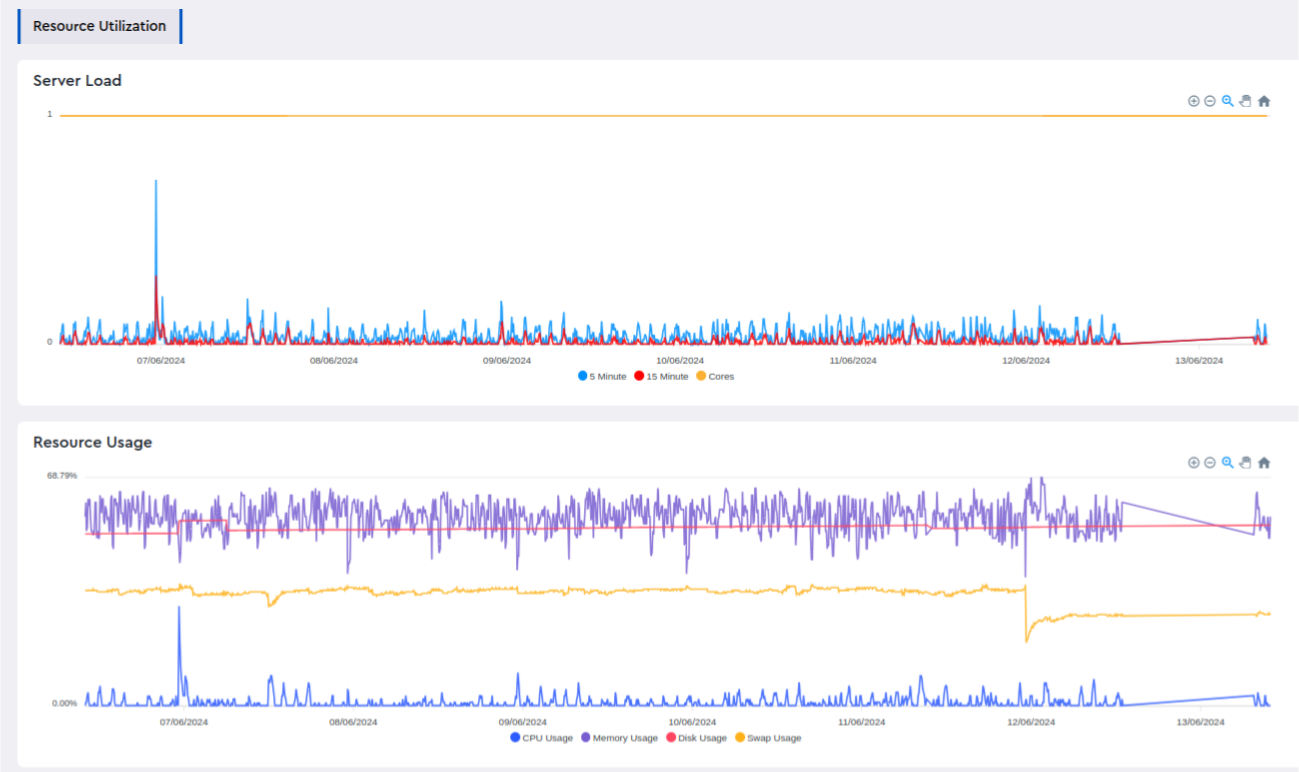
- The dashboard displays Resource Utilization Logs as charts, highlighting Server Load and Resource Usage for specific servers.
- You can view graphs showing server load, including the number of cores, over 15-minute and 5-minute intervals. The resource usage section offers detailed charts on CPU usage, memory usage, disk usage, and swap usage, allowing for comprehensive analysis of server performance. These visualizations help in monitoring and managing server resources effectively.
Step 5: IP Traffic Insights:
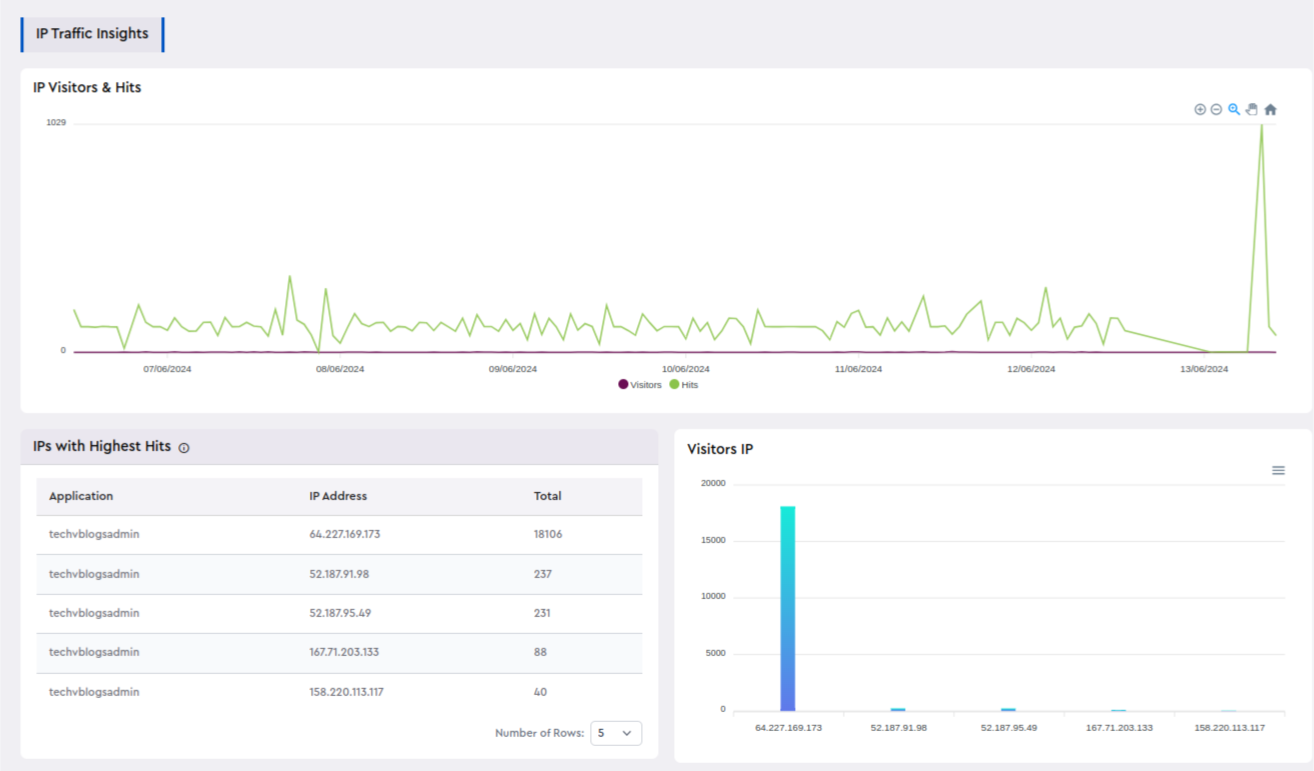
The IP Traffic Insights feature provides a detailed view of the traffic directed towards your application. Here, you can analyze which IP addresses have the highest number of hits and track the visitors accessing your application.
The insights are divided into two types of data displayed in charts:
Visitors: This metric indicates the total number of unique visitors accessing your application.
Hits: This metric shows the total count of visits made to your application, including all interactions.
Additionally, you can view charts that display the distribution of visitors by IP address and the corresponding hits from each IP. A table presents a list of IP addresses along with the total number of hits originating from each IP address, providing a clear overview of traffic patterns.
Step 6: Referral Insights:
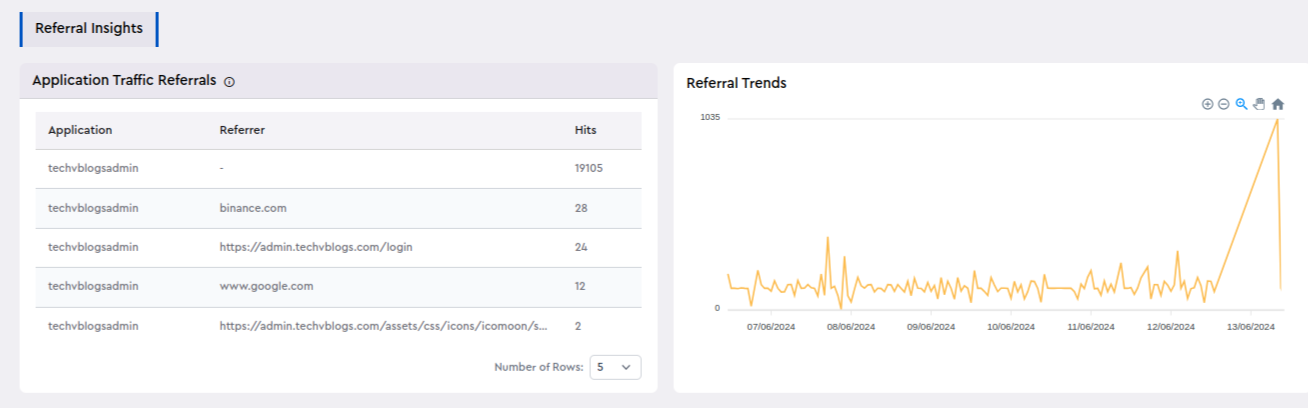
The "Referrer insights" section lists all applications running on the server along with their respective hit counts. It provides information on the sources of traffic that have visitors to your application. A chart is included to visually represent the number of referrals.
The application dashboard section offers a variety of more features for your applications, including Bandwidth Usage, Request Analysis, Endpoint Activity, User Agent & Bot Details, Traffic Distribution, Bots and Visitors Filter. You can explore and analyze these features in detail to gain insights into your application's performance.