Application Dashboard
The Application Dashboard offers a detailed overview of all applications on your servers. Each application's data is displayed in a tabular format, where you can filter and select specific servers to focus on. Here are the steps to navigate through the applications across your server.
Step 1: First, log in to the InsightHub panel, Click on the Applications option.
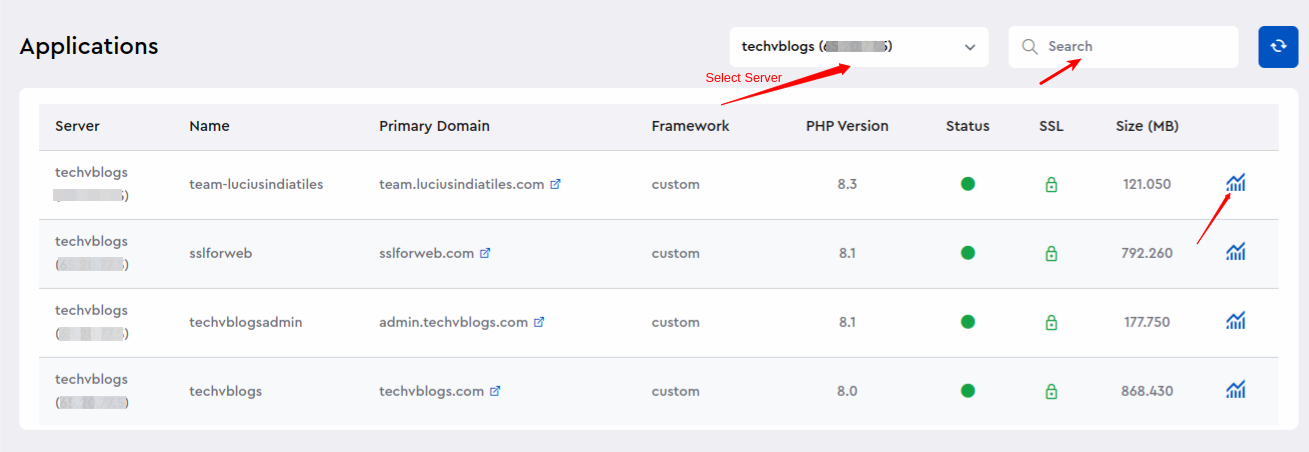
Step 2: You can see the Dashboard of Applications like below.
You can see essential details including server name, IP address, application name, primary domain, framework, PHP version, application status, SSL status, and application size (in MB).
You can select a specific server to view all its applications and details by selecting the server from above option. Additionally, you can search for applications by name using the search option.
Click on the graph icon next to any application to access an in-depth view of that particular application. This will take you to the application overview page, where you can see and check all the details about the application.
Step 3: Clicking on the graph icon will display the Application overview page for the specific application, as shown below.
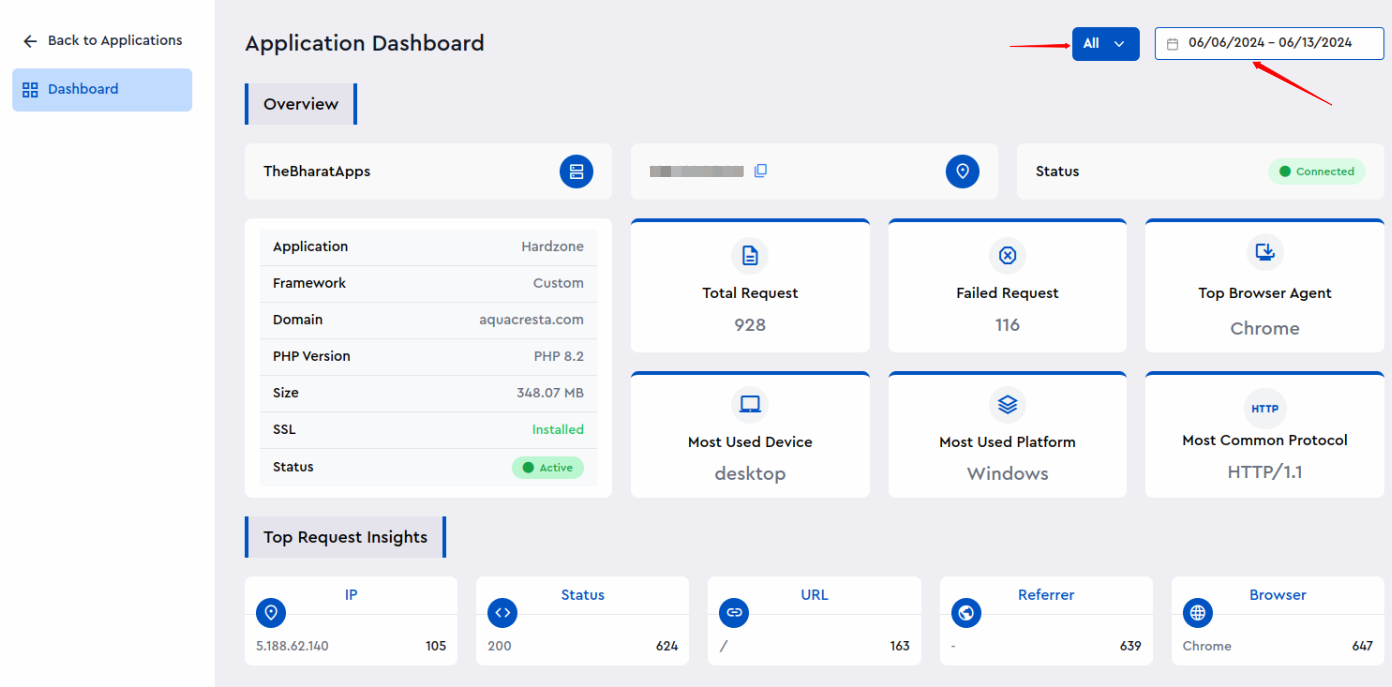
You can filter this data by selecting a specific date or a date range. By default, you can view the traffic data from both bots and visitors to your application, also you have the option to filter it based on bot activity and visitor interactions.
You can view the application overview, including details such as framework, domain, PHP version, size, SSL, Application status.
You can see information about the total number of requests, failed requests, top browser agent, most frequently used device, predominant platform, and common protocols received by the application.
Step 4: Access Log Summary:
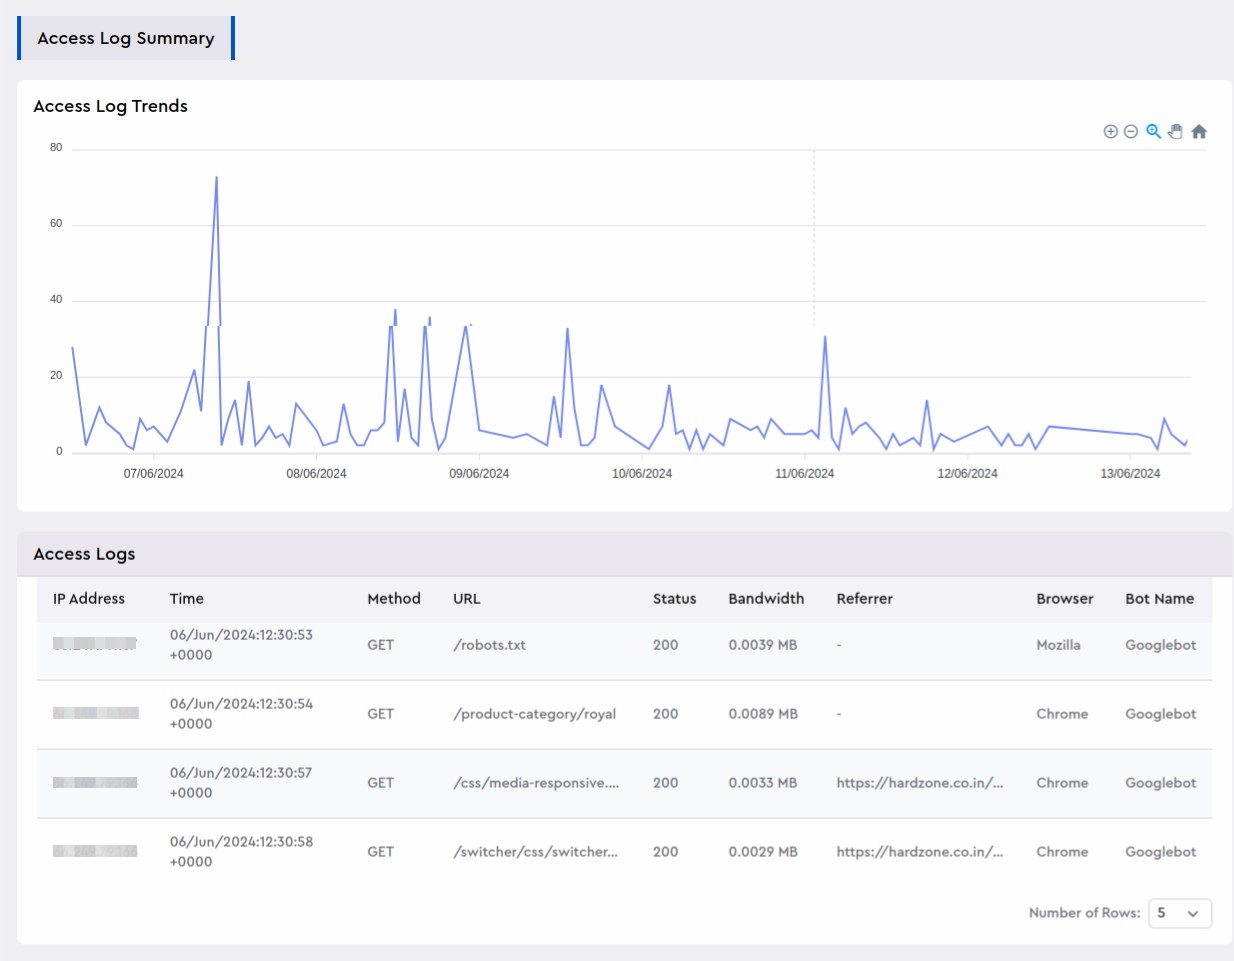
The dashboard displays chart for Access Log Trends and table for access logs in a detailed and organized format.
These data include details like IP addresses, timestamps indicating when requests were made, methods used for accessing URLs, statuses of these requests, bandwidth consumed, referrers, specific browser, and identification of bots accessing the application.
This visual representation helps administrators and users alike to track and analyze how the application is being accessed and interacted with over time.
Step 5: Error Analysis:
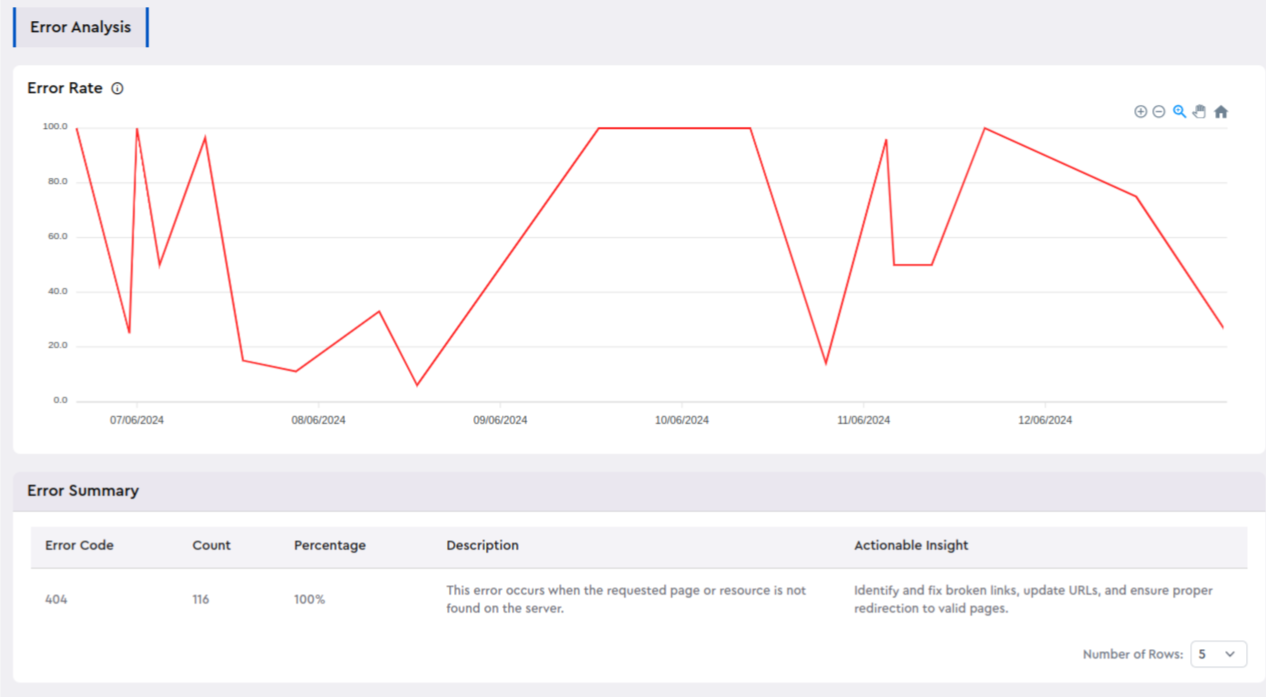
The dashboard provides visual representations and structured data tables summarizing error logs.
Error Analysis chart illustrates the error rate over time, offering a clear trend analysis. Meanwhile, the accompanying table presents a comprehensive summary of error logs, detailing key metrics such as error codes, occurrence counts, percentage, descriptions of each errors.
This combined approach equips users with both a high-level overview and necessary details for understanding and addressing errors effectively within the system or application.
Step 6: IP Traffic Insights:
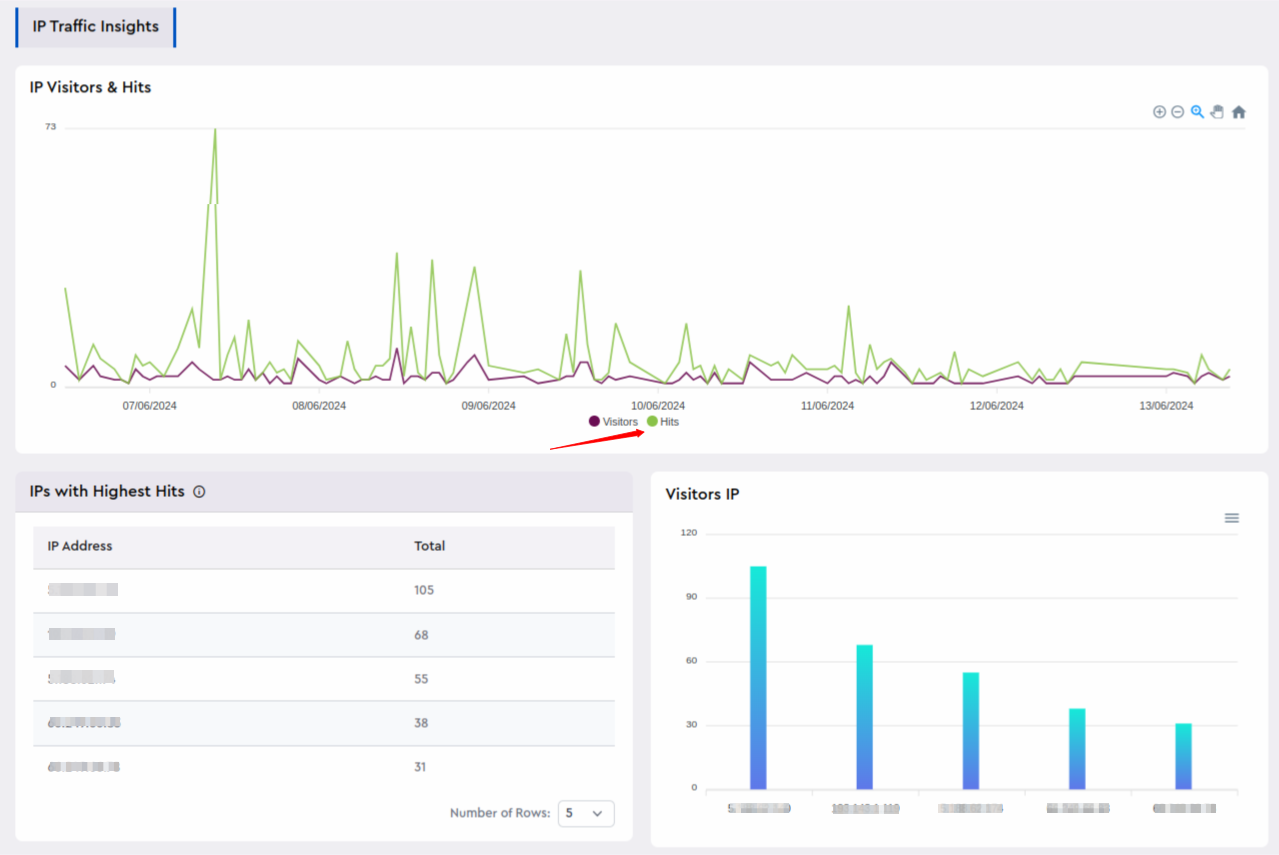
The IP Traffic Insights feature provides a detailed view of the traffic directed towards your application. Here, you can analyze which IP addresses have the highest number of hits and track the visitors accessing your application.
The insights are divided into two types of data displayed in charts:
Visitors: This metric indicates the total number of unique visitors accessing your application.
Hits: This metric shows the total count of visits made to your application, including all interactions.
Additionally, you can view charts that display the distribution of visitors by IP address and the corresponding hits from each IP. A table presents a list of IP addresses along with the total number of hits originating from each IP address, providing a clear overview of traffic patterns.
Step 7: Referral Insights:
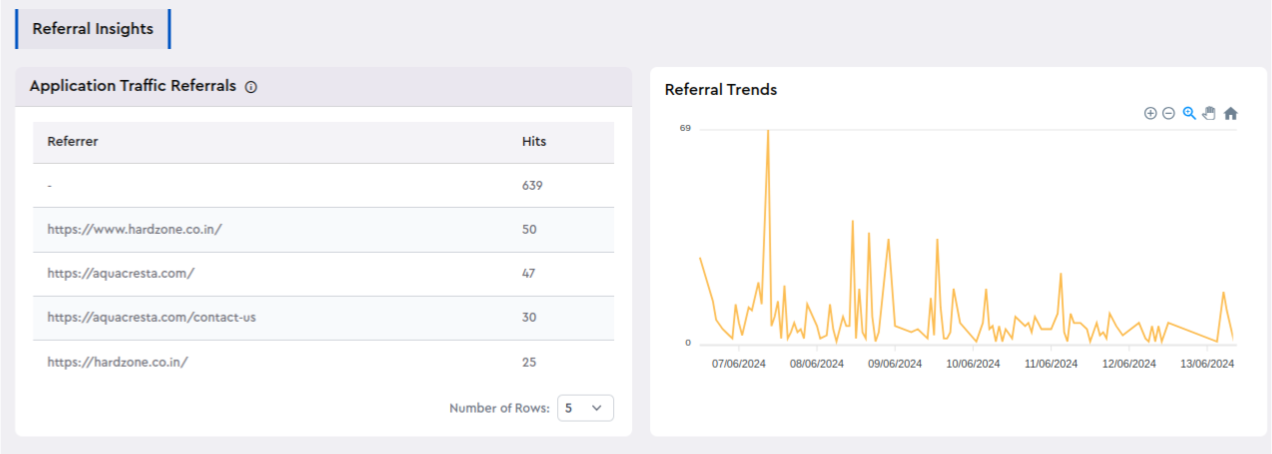
The "Referrer insights" section lists all applications running on the server along with their respective hit counts. It provides information on the sources of traffic that have visitors to your application. A chart is included to visually represent the number of referrals.
The application dashboard section offers a variety of more features for your applications, including Bandwidth Usage, Request Analysis, Endpoint Activity, User Agent & Bot Details, Traffic Distribution, Bots and Visitors Filter. You can explore and analyze these features in detail to gain insights into your application's performance.