Bandwidth
The Bandwidth Analysis Dashboard provides a detailed overview of bandwidth consumption, helping administrators monitor network usage, detect unusual activity, and optimize resource allocation.
Overview Metrics
Key statistics displayed in this section include:
-
Total Usage: The total bandwidth consumed by all requests.
-
Average Bandwidth Per Request: The average data usage per request.
-
Most Consuming URL: The URL that has consumed the highest amount of bandwidth.
-
Most Usage by Country: Identifies the country with the highest bandwidth consumption.
These metrics help in assessing overall network efficiency and identifying potential bandwidth-heavy operations.

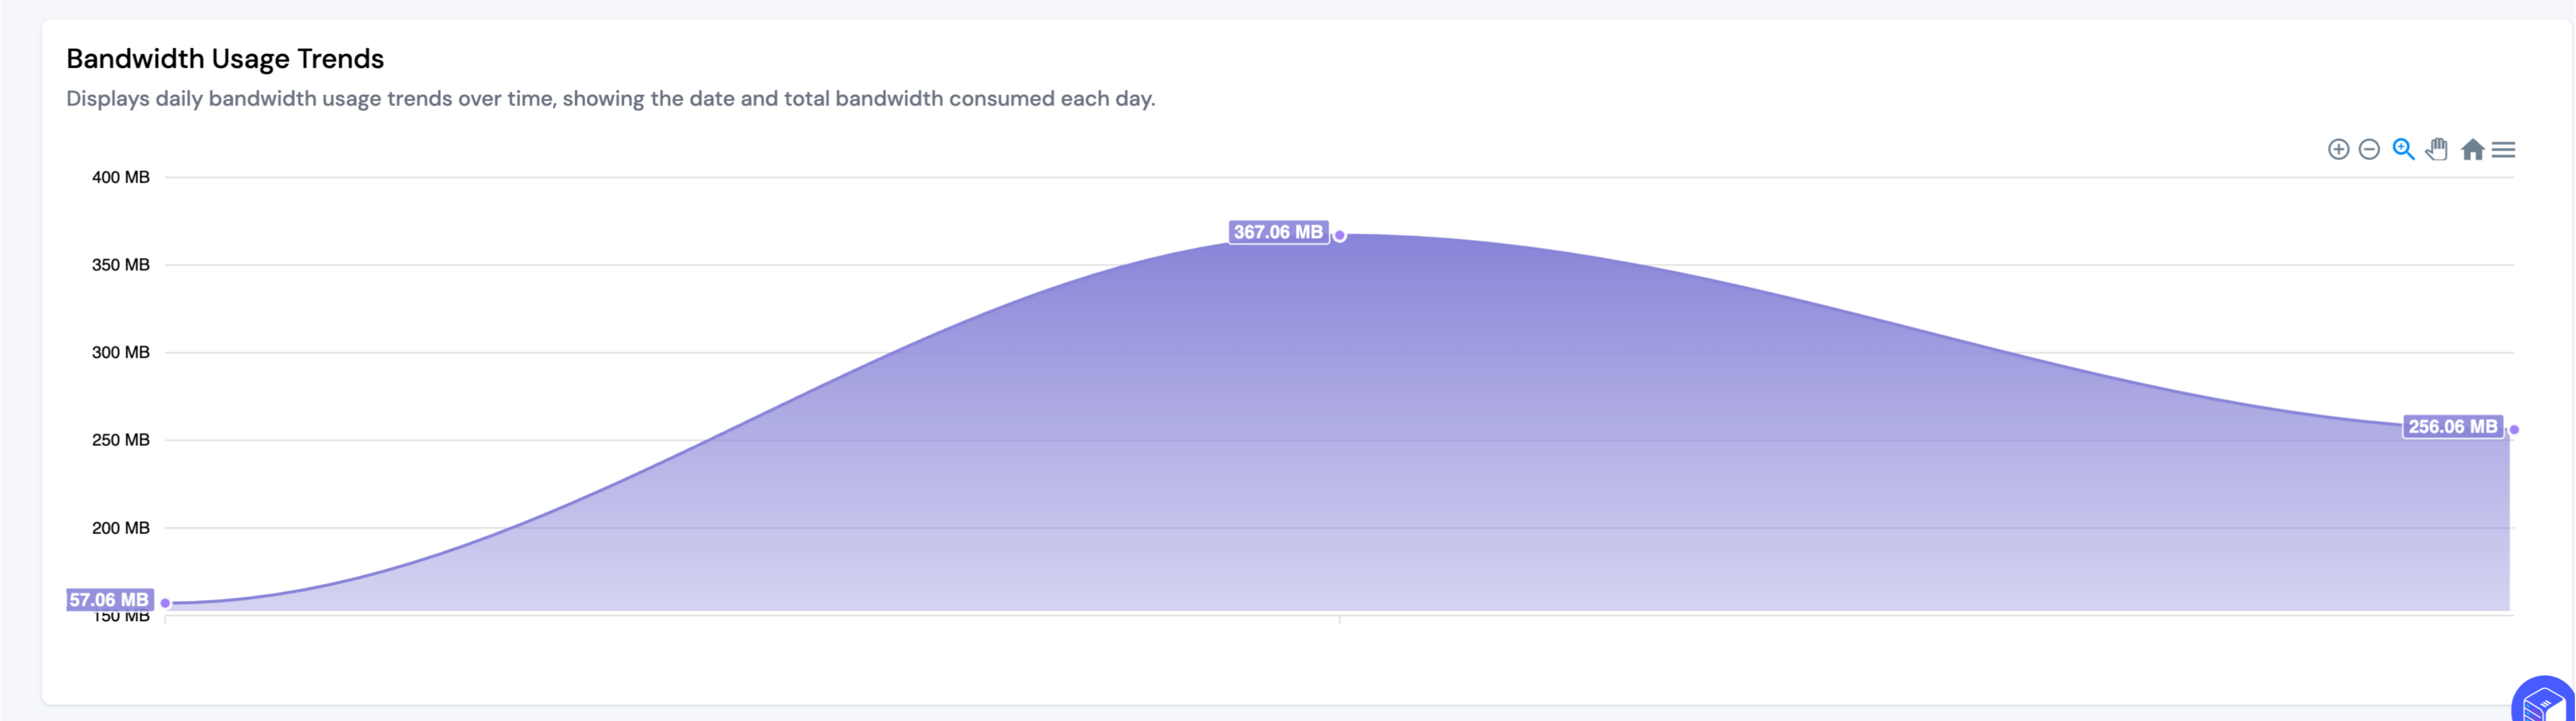
Bandwidth Usage Trends
A graphical representation of daily bandwidth usage trends provides insights into:
-
Historical Bandwidth Consumption: Displays bandwidth usage per day.
-
Anomalies & Spikes: Helps detect unusual traffic patterns.
Monitoring these trends aids in optimizing bandwidth allocation and identifying potential issues, such as excessive bot traffic or high-resource-consuming pages.
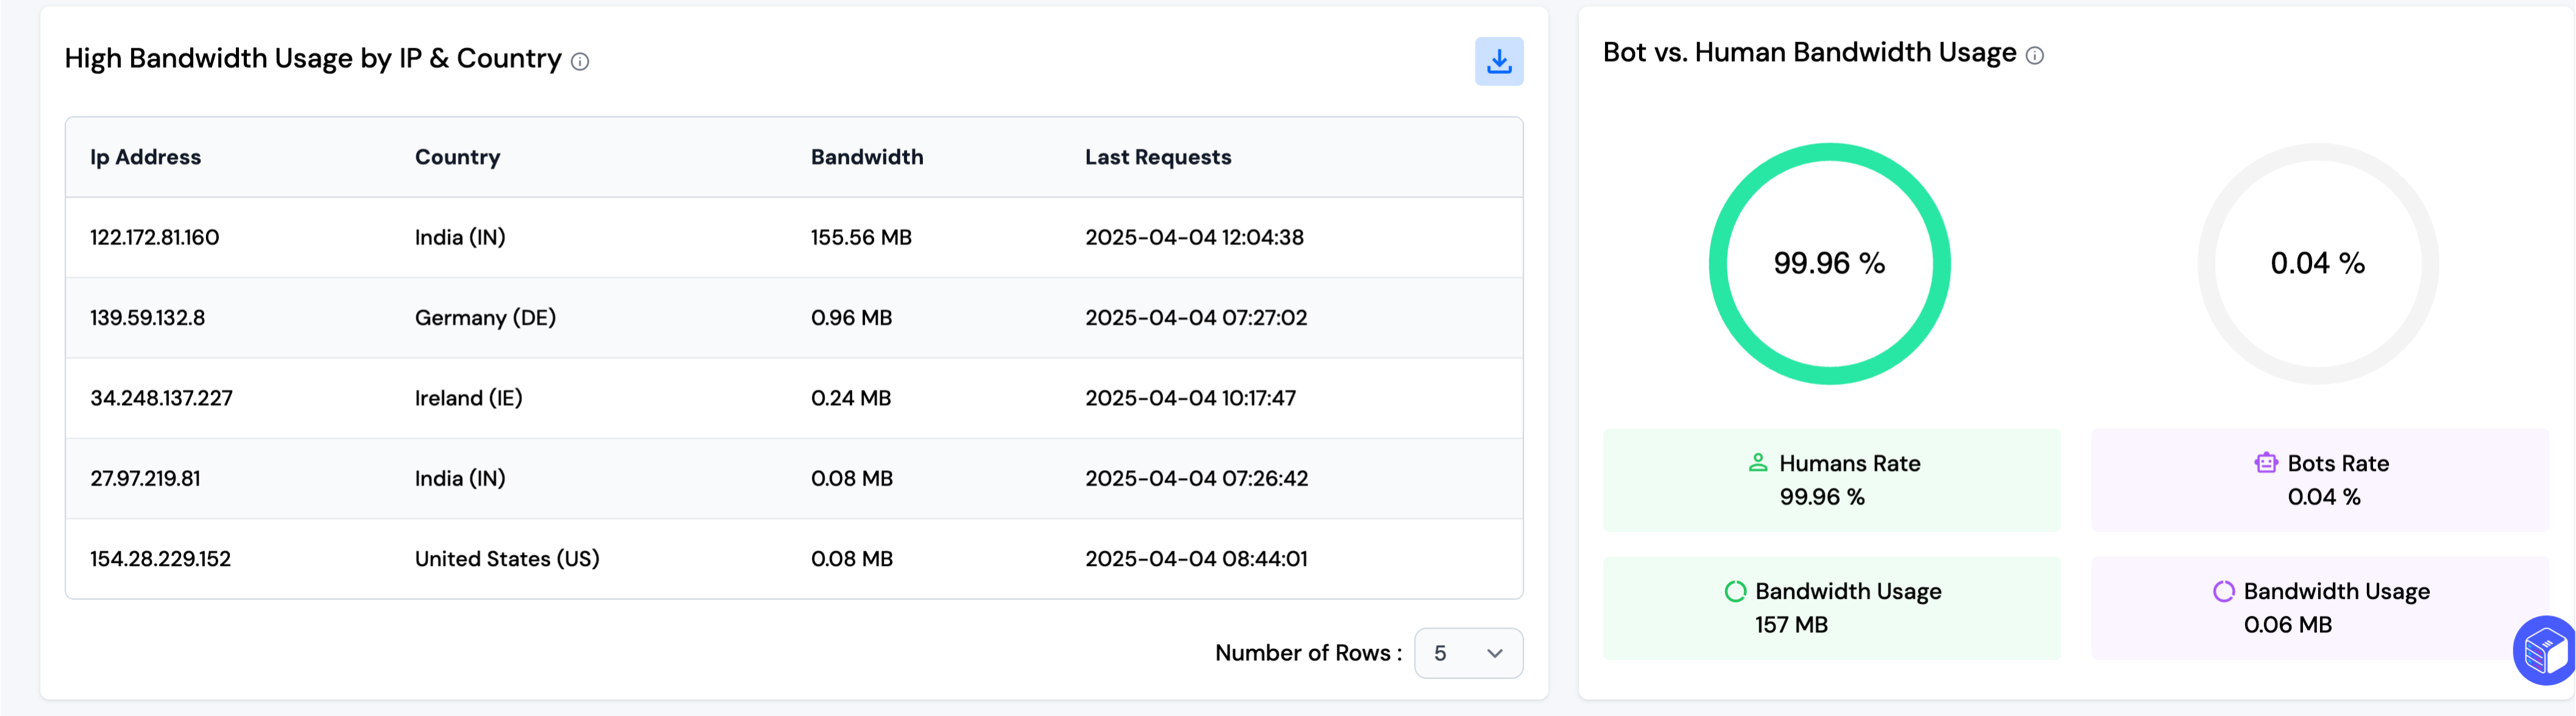
High Bandwidth Usage by IP & Country
This section highlights IP addresses and their respective countries that are consuming the most bandwidth. It provides details such as:
-
IP Address: The source of the requests.
-
Country: The geographical location of the IP.
-
Bandwidth Used: The total bandwidth consumed by that IP.
-
Last Request Timestamp: The latest request made by the IP.
Tracking high bandwidth-consuming IPs helps detect potential abuse, such as web scraping or DDoS attacks.
Bot vs. Human Bandwidth Usage
A comparison between bot and human traffic is shown to distinguish between legitimate and automated requests. Key metrics include:
-
Human Traffic Rate: Percentage of bandwidth used by human users.
-
Bot Traffic Rate: Percentage of bandwidth used by bots or automated scripts.
-
Total Bandwidth Usage: Breakdown of how bandwidth is being consumed.
This information helps administrators filter out unwanted bot traffic that could be consuming excessive resources.
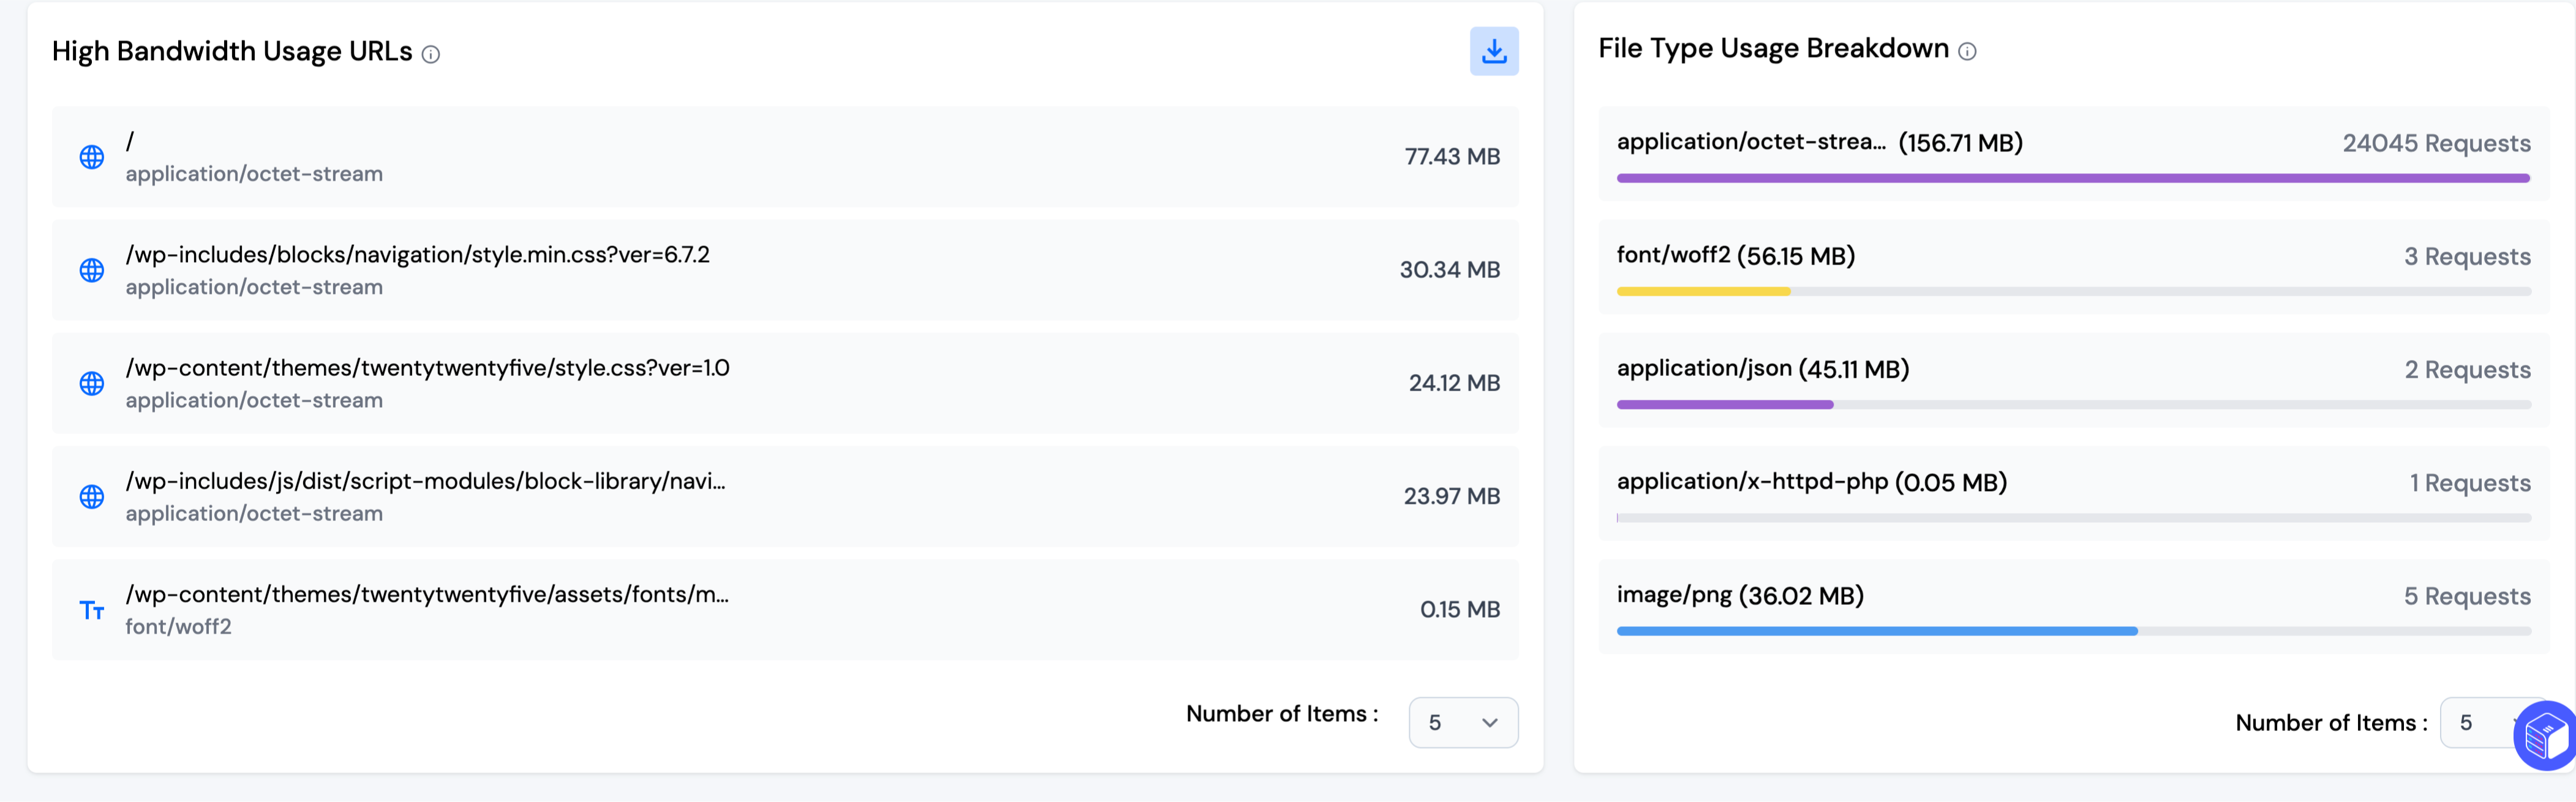
High Bandwidth Usage URLs
This section lists the most bandwidth-consuming URLs, detailing:
-
Requested URLs: The web pages or assets consuming the most bandwidth.
-
Data Usage per URL: The total bandwidth consumed by requests to that URL.
This data is useful for optimizing resource-heavy pages, identifying unnecessary large file requests, and improving caching strategies.
File Type Usage Breakdown
A breakdown of file types consuming bandwidth is provided, showing:
-
File Type: The content type of requested files (e.g., images, scripts, fonts).
-
Bandwidth Usage: Total data consumption for each file type.
-
Request Count: Number of requests made for each file type.
This breakdown helps in optimizing static resources, reducing unnecessary file loads, and improving website performance.
Note: You can download the full data of the table as a CSV file using the download button. By default, five rows are shown, but you can increase the count using the dropdown menu.