
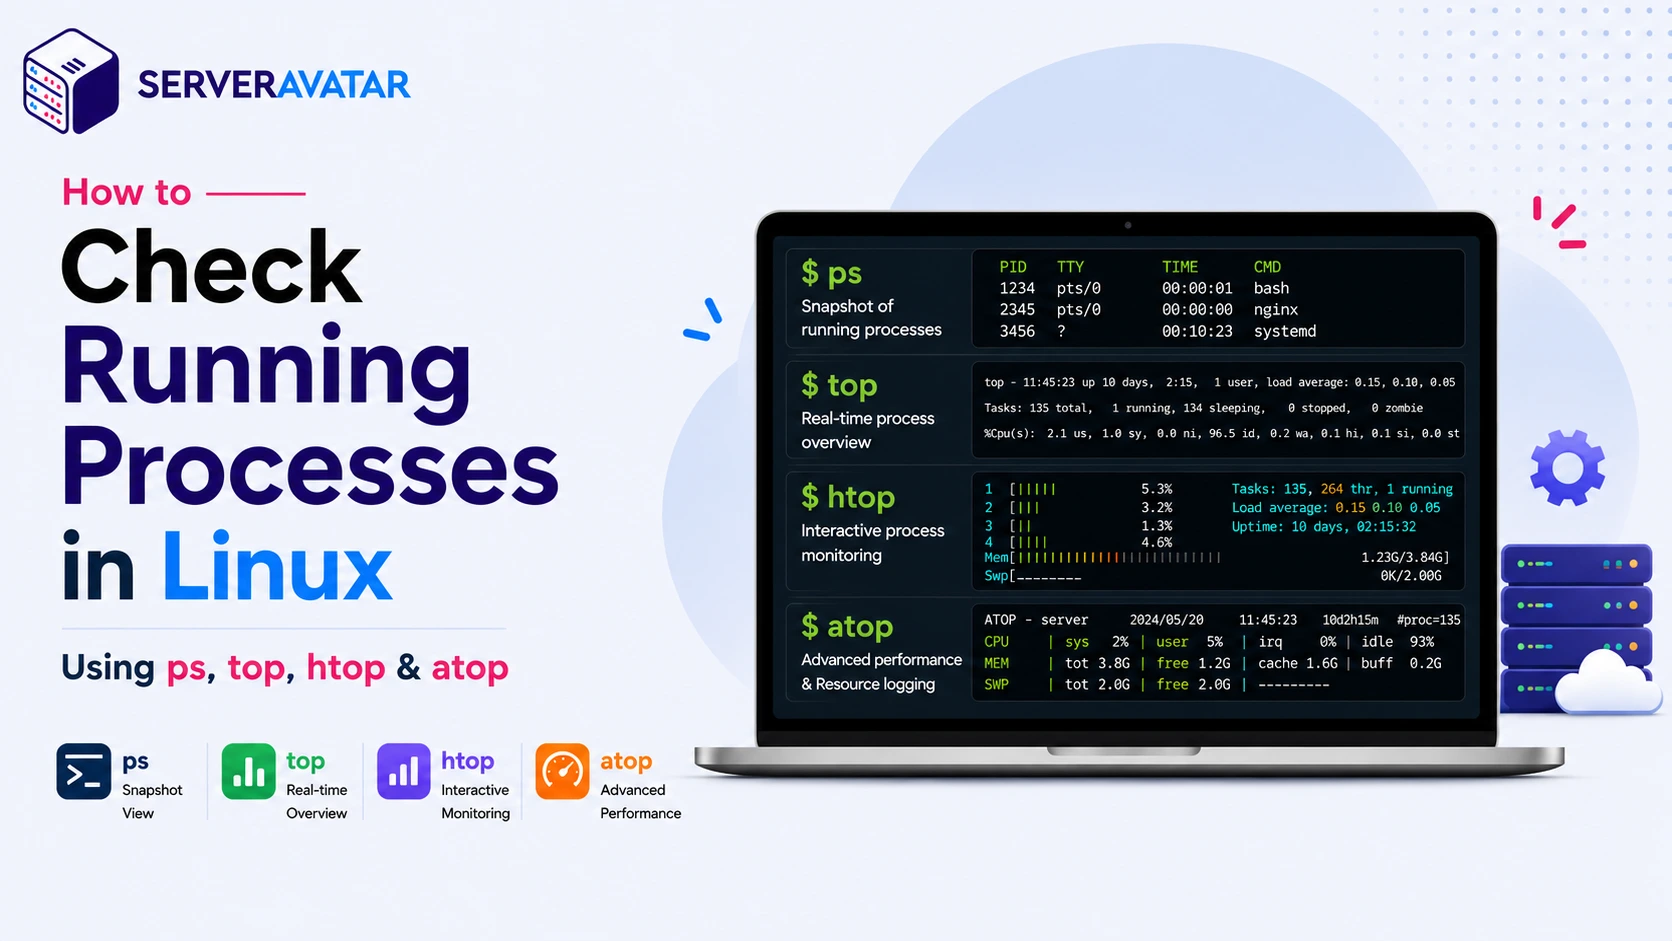

Managing a Linux server involves more than installing applications and keeping the system updated. To check running processes activity effectively, it’s important to understand how Linux manages every service, from a web server and database to scheduled jobs and background scripts. When a website becomes slow, CPU usage suddenly spikes, or memory starts disappearing, the first place to investigate is the list of running processes.
Linux offers several built-in and advanced tools for monitoring what’s happening inside your system. Some provide a quick snapshot of active processes, while others continuously update resource usage in real time or record historical performance data for deeper analysis.
If you’re new to Linux administration, choosing between commands like ps, top, htop, and atop can be confusing because they all display process information in different ways. Knowing when to use each one can save time during troubleshooting and help you identify performance bottlenecks much faster.
In this guide, you’ll learn what each tool does and how to use it effectively with practical examples.
TL;DR
- Linux processes are running instances of applications or system services.
- The ps command provides a snapshot of currently running processes.
- top displays live CPU, memory, and process activity directly in the terminal.
- htop offers an interactive, user-friendly interface with easier navigation and process management.
- atop records system activity over time, making it useful for diagnosing performance issues that occurred earlier.
- Each tool serves a different purpose, and many administrators use them together for a more complete view of system performance.
Why Process Monitoring Matters in Linux
Every application running on your Linux server consumes system resources such as CPU time, memory, storage, or network bandwidth. Unexpected events like a runaway script, an overloaded web application, or a failing service can quickly affect overall system performance.
Regularly monitoring running processes helps you:
- Identify applications consuming excessive CPU or memory.
- Detect unresponsive or stuck processes.
- Troubleshoot slow server performance.
- Verify that essential services are running correctly.
- Monitor applications after deployments or configuration changes.
- Discover unusual resource usage before it impacts users.
Whether you’re managing a personal VPS or multiple production servers, understanding your system’s active processes makes troubleshooting significantly easier.
Tip: Process monitoring isn’t only for fixing problems. It’s equally useful for validating that a server is operating as expected after updates, deployments, or maintenance.
What Is a Linux Process?
A process is simply a program that is currently running on your Linux system. Every time you execute a command, start a service, or launch an application, Linux creates one or more processes to perform the required tasks.
For example:
- Starting the Apache or Nginx web server creates server processes.
- Connecting to a server over SSH starts a user session process.
- Running a backup script creates a temporary process until the job finishes.
- Database servers like MySQL or PostgreSQL continuously run multiple background processes to handle queries and maintenance tasks.
Each process is assigned a unique Process ID (PID), which allows the operating system to manage it independently.
Understanding these basics makes it much easier to interpret the output of process monitoring tools later in this guide. All utilities display process information, they solve different problems. Choosing the right one depends on whether you need a quick snapshot, continuous monitoring, easier navigation, or historical performance records.
| Tool | Best For | Live Monitoring | Interactive | Historical Data |
|---|---|---|---|---|
| ps | Viewing a snapshot of running processes | ❌ | ❌ | ❌ |
| top | Monitoring processes in real time | ✅ | Basic | ❌ |
| htop | Interactive process management | ✅ | ✅ | ❌ |
| atop | Performance analysis and long-term monitoring | ✅ | ✅ | ✅ |
When Should You Use Each Tool?
There’s no single “best” command for every situation. Instead, each utility fits a specific workflow.
| Scenario | Recommended Tool |
|---|---|
| Check whether a process is running | ps |
| Watch CPU and memory usage live | top |
| Search, filter, and manage processes interactively | htop |
| Investigate performance issues from earlier in the day | atop |
| Diagnose high server load | top or htop |
| Analyze long-running resource trends | atop |
Choosing the appropriate tool not only speeds up troubleshooting but also gives you more relevant information without unnecessary complexity.
Checking Running Processes with the ps Command
If you only need to verify whether a process is running or want a quick overview of active processes, the ps command is usually the best place to start.
This makes it ideal for quick checks, scripting, and troubleshooting tasks where you need accurate process information without continuously monitoring the system.
What Is the ps Command?
The ps (Process Status) command is a built-in Linux utility that displays information about running processes. It displays:
- Process IDs (PIDs)
- Parent process IDs (PPIDs)
- Process owner
- CPU and memory usage
- Running time
- Terminal association
- Current process state
- The command used to start the process
Since ps only displays the current state of the system, running it again later may produce different results if processes have started or stopped.
Basic Syntax
ps [options]You will see output as mentioned below:

Without any options:
psExample Output
PID   TTY          TIME     CMD
2184  pts/0        00:00:00 bash
2671  pts/0        00:00:00 ps
What This Means
| Column | Description |
|---|---|
| PID | Unique Process ID assigned by Linux |
| TTY | Terminal associated with the process |
| TIME | Total CPU time consumed |
| CMD | Command that started the process |
By default, this output is limited to processes running in your current terminal session.
Viewing Every Running Process
For most server management tasks, you’ll need to view every running process on the system rather than only those associated with your current terminal session.
Use:
ps -eor
ps -ABoth commands display every running process on the system. This is especially useful when:
- Verifying background services
- Checking application status
- Confirming daemon processes are active
- Looking for unexpected programs
Display More Process Details
The default output is intentionally brief. To include additional information such as the parent process, owner, and startup details, use:
ps -efSample Output
UID        PID  PPID  C STIME TTY      TIME CMD
root         1     0  0 Jul16 ?        00:00:03 systemd
root       728     1  0 Jul16 ?        00:00:01 sshd
mysql     1458


1 1 Jul16 ? 00:00:12 mysqldThis format is commonly used when troubleshooting production servers because it provides much more context than the default view.
Finding a Specific Process
Instead of scanning hundreds of running processes manually, you can search for a particular application.
For example, to locate Nginx processes:
ps -ef | grep nginxExample output:
root      1024     1  0 09:30 ? 00:00:00 nginx: master process
www-data 1051 1024 0 09:30 ? 00:00:00 nginx: worker processSimilarly, you can search for:
ps -ef | grep apache2
ps -ef | grep apache2
ps -ef | grep mysqlor any other service running on your server.
Tip: If the only result you see is the
grepcommand itself, the target process is likely not running.
Show Processes for a Particular User
When multiple users share the same Linux server,
filtering processes by username can make the output much easier to read.
ps -u usernameExample:
ps -u ubuntuThis displays only the processes owned by the ubuntu user. Common use cases include:
- Shared hosting environments
- Multi-user development servers
- Investigating resource usage for a specific account
Display Information for a Specific Process ID
If you already know the Process ID (PID), you can retrieve information about that process directly.
ps -p 1842To display additional columns:
ps -fp 1842This is particularly useful when documentation or log files reference a specific PID during troubleshooting.
Customize the Output
One of the strengths of the ps command is its flexibility. Instead of displaying every available column, you can choose exactly what information you need.
For example:
ps -eo pid,user,%cpu,%mem,cmdPossible output:
PID   USER     %CPU %MEM COMMAND
1024  root      0.0  0.3 nginx
1458  mysql     4.2  6.8 mysqld
2083 ubuntu 0.1 1.2 node server.jsSort by Memory Usage
ps -eo pid,user,%mem,cmd --sort=-%memThese commands place the busiest processes at the top of the list, making it much faster to identify potential bottlenecks.
Practical Examples
Check if the SSH service is running
ps -ef | grep sshdFind the PID of a Node.js application
ps -ef | grep nodeList only process IDs
ps -eo pidShow CPU and memory usage together
ps -eo pid,user,%cpu,%mem,cmdIdentify the highest CPU-consuming process
ps -eo pid,%cpu,cmd --sort=-%cpu | headAdding head limits the output to the top entries, making the results easier to review.
Common Mistakes Beginners Make
Learning to use ps is straightforward, but a few common mistakes can lead to confusion.
| Mistake | Better Approach |
|---|---|
Assuming ps updates automatically | Run the command again or use top/htop for live monitoring. |
| Searching manually through long output | Use grep or customized output columns to narrow results. |
Forgetting that ps is only a snapshot | Remember that processes may change immediately after the command runs. |
| Using default output for troubleshooting | Use options like -ef or -eo to view more useful details. |
When Should You Choose ps?
The ps command is an excellent choice when you need quick, accurate information without launching an interactive monitoring session.
Use it when you want to:
- Confirm that an application or service is running.
- Retrieve a process ID before sending a signal.
- Generate process reports in shell scripts.
- Inspect running services during troubleshooting.
- Create custom process lists for automation.
If you need to watch processes continuously as CPU and memory usage change in real time, however, ps is no longer the ideal tool.
In the next section, we’ll explore top, which provides a live, continuously updating view of your system and is often the first utility administrators use when diagnosing performance issues.
If you need to stop a misbehaving process after identifying it, check out our detailed guide on How to Kill a Running Process in Linux.
Monitoring Linux Processes in Real Time with top
The ps command shows the current state of running processes, but its output is static and doesn’t refresh automatically. When you need to monitor CPU usage, memory consumption, or system load as they change, the top command is the better choice.
What Is the top Command?
The top command is a built-in Linux monitoring tool that displays a live, continuously updating view of system performance and active processes, making it ideal for troubleshooting performance issues in real time.
It’s particularly useful for:
- Diagnosing slow server performance
- Identifying CPU-intensive applications
- Finding memory-hungry processes
- Monitoring services after deployments
- Troubleshooting unexpected load spikes
Because the display refreshes automatically, you can observe how processes behave over time instead of relying on a single snapshot.
Launching top
Open your terminal and run:
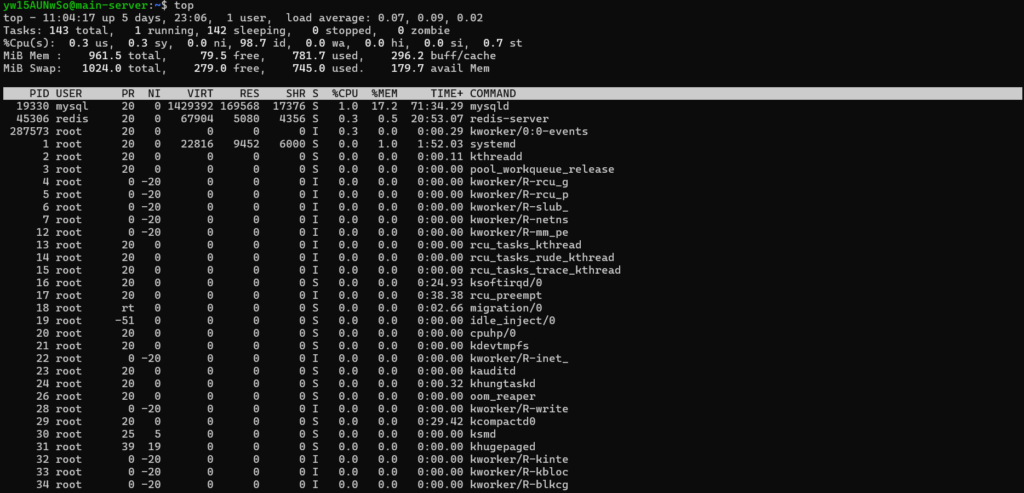
topWithin a few seconds, your terminal transforms into a live monitoring interface.
Understanding the top Interface
Although the screen may appear busy at first, it’s organized into two primary sections.
System Summary
The top portion provides an overview of your server’s health, including:
- Current system uptime
- Number of logged-in users
- Load averages
- CPU utilization
- Physical memory usage
- Swap memory usage
- Total running and sleeping processes
This information gives you an immediate sense of whether the system is under normal load or experiencing resource pressure.
Process List
The lower section displays active processes. Some of the most useful columns include:
| Column | Meaning |
|---|---|
| PID | Process ID |
| USER | Owner of the process |
| PR | Scheduling priority |
| NI | Nice value |
| VIRT | Total virtual memory allocated |
| RES | Physical RAM currently in use |
| SHR | Shared memory |
| S | Current process state |
| %CPU | CPU utilization |
| %MEM | Percentage of memory used |
| TIME+ | Total CPU time consumed |
| COMMAND | Program or service name |
These values update automatically, making it easy to spot changing resource usage.
Although running top without options is enough in most situations, several command-line options make it even more useful.
Monitor a Specific User
To display only the processes owned by a particular user:
top -u usernameExample:
top -u ubuntuThis reduces clutter when multiple users share the same server.
Watch Specific Processes
If you already know a process ID, monitor only that process.
top -p 2458This is especially useful while testing an application or observing resource usage after restarting a service.
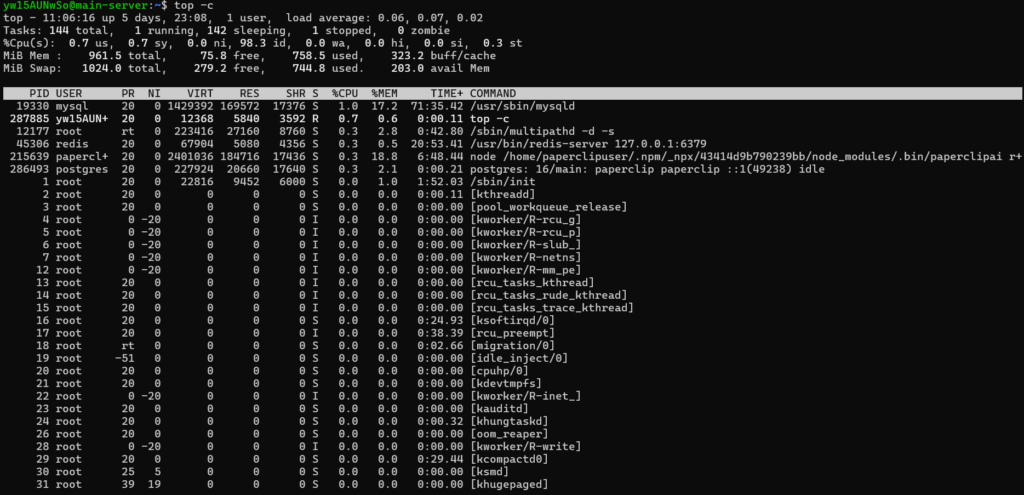
Display Full Command Lines
Instead of showing only executable names:
top -cThis displays the complete command used to launch each process, making it easier to distinguish between similar applications.
Run in Batch Mode
Sometimes you need to save monitoring output for later analysis:
top -b -n 5This captures five updates before exiting.
You can also redirect the output into a file:
top -b -n 5 > process_report.txtBatch mode is commonly used in automation scripts and scheduled diagnostics.
Useful Interactive Shortcuts
Once top is running, you can adjust many settings directly from the interface without restarting the command. Several keyboard shortcuts let you adjust the display instantly.
| Key | Action |
|---|---|
| P | Sort by CPU usage |
| M | Sort by memory usage |
| T | Sort by running time |
| c | Toggle full command display |
| u | Filter by user |
| k | Kill a process |
| h | Show help |
| q | Exit top |
Learning just a few of these shortcuts can significantly improve your workflow.
When Is top the Right Choice?
The top command shines when you need to observe how a server behaves over time. Typical scenarios include:
- A website becomes slow during peak traffic.
- CPU usage suddenly reaches 100%.
- Memory consumption keeps increasing.
- You suspect a process has entered an infinite loop.
- You want to verify resource usage immediately after deployment.
Since the display refreshes continuously, you can watch changes as they happen instead of repeatedly rerunning commands.
Limitations of top
Although top is extremely useful, it isn’t perfect. Some common limitations include:
- The interface can feel overwhelming for beginners.
- Navigation relies entirely on keyboard shortcuts.
- Finding a specific process among hundreds can take time.
- Colors and layout vary between Linux distributions.
- Historical performance data isn’t retained.
For many administrators, these limitations lead them to an enhanced alternative: htop.
Why Many Linux Users Prefer htop
If you find top difficult to navigate, htop offers a more user-friendly alternative. It provides the same core process information in a cleaner, color-coded interface with features like search, filtering, tree view, and easier process management.
For many Linux administrators, htop is the preferred tool for everyday system monitoring.
Installing htop
Unlike ps and top, htop isn’t installed by default on many Linux distributions.
Ubuntu and Debian
sudo apt update
sudo apt install htopRHEL, AlmaLinux, Rocky Linux, and CentOS
sudo dnf install htopOlder CentOS versions may use:
sudo yum install htopLaunch htop
Once installed, start it by running:
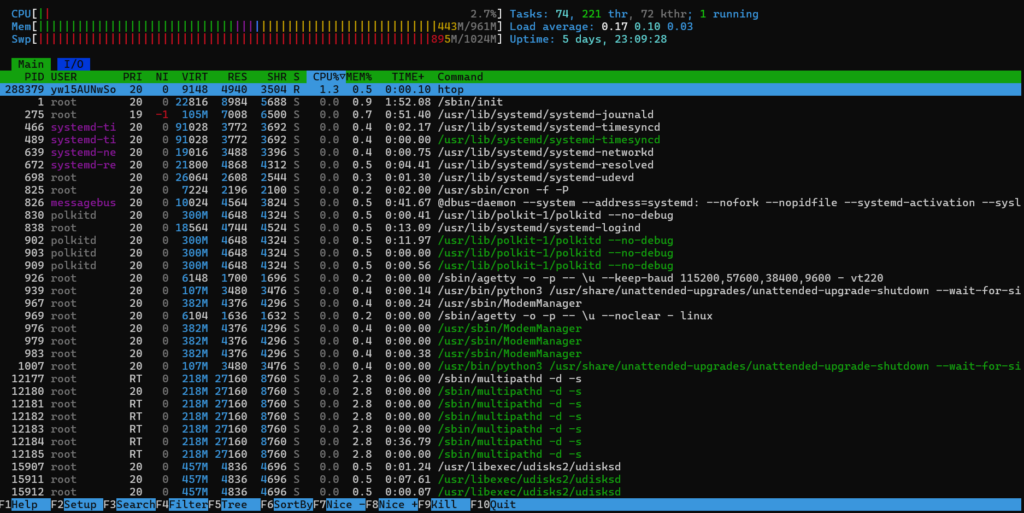
htopYou’ll immediately notice a cleaner interface compared to top.
What Makes htop Different?
Instead of presenting a wall of constantly changing text, htop organizes information in a more user-friendly way.
Some improvements include:
- Color-coded CPU, memory, and swap usage
- Vertical and horizontal scrolling
- Easy process searching
- Interactive filtering
- Tree view for parent-child processes
- Mouse support in supported terminals
- Function-key shortcuts displayed on screen
These features make htop easier to learn and use, especially for those new to Linux administration.
Useful Keyboard Shortcuts
| Key | Function |
|---|---|
| F3 | Search for a process |
| F4 | Filter process list |
| F5 | Tree view |
| F6 | Choose sorting method |
| F9 | Terminate selected process |
| F10 | Exit |
| Space | Tag a process |
Unlike top, many common actions are visible directly on the screen, making navigation much easier.
Common Use Cases for htop
htop is particularly helpful when you need to:
- Search for a specific application quickly
- Sort processes by memory or CPU usage
- Kill misbehaving processes interactively
- Understand parent-child process relationships
- Monitor multiple applications during deployments
Because of its intuitive interface, it’s often recommended for developers and system administrators who spend a lot of time managing Linux servers.
top vs htop
| Feature | top | htop |
|---|---|---|
| Installed by default | ✅ | ❌ |
| Live monitoring | ✅ | ✅ |
| Search processes | Limited | ✅ |
| Mouse support | ❌ | ✅ |
| Tree view | ❌ | ✅ |
| Easier navigation | Basic | Excellent |
| Color interface | Minimal | Rich and readable |
If top gives you the information you need, there’s no requirement to switch. However, if you frequently troubleshoot servers, htop can make the process considerably faster and more comfortable.
Looking Beyond Real-Time Monitoring with atop
Both top and htop are great for monitoring what’s happening right now, but they can’t show what happened before you logged in.
That’s where atop is different. It records system activity over time, allowing you to review historical CPU, memory, disk, and process usage. This makes it especially useful for investigating intermittent performance issues and identifying resource bottlenecks that are no longer active.
Using atop for Advanced Linux Process Monitoring
The atop command combines real-time monitoring with historical performance logging, giving you a more complete view of your system’s behavior. It’s particularly valuable on production servers, where occasional CPU spikes, memory pressure, or disk I/O issues may occur outside your monitoring window.
By reviewing past activity, atop helps you diagnose problems that live monitoring tools might miss.
Installing atop
Most Linux distributions don’t install atop by default, so you’ll need to add it manually.
Ubuntu and Debian
sudo apt update
sudo apt install atopRHEL, AlmaLinux, Rocky Linux, and CentOS
sudo dnf install atopOlder CentOS releases may require:
sudo yum install atopAfter installation, some distributions automatically enable the logging service, while others may require you to start or enable it manually.
Starting atop
Launch the interactive interface with:
atopLike top, you’ll see continuously updating statistics, but atop provides additional information about system resources and supports reviewing previously recorded data.
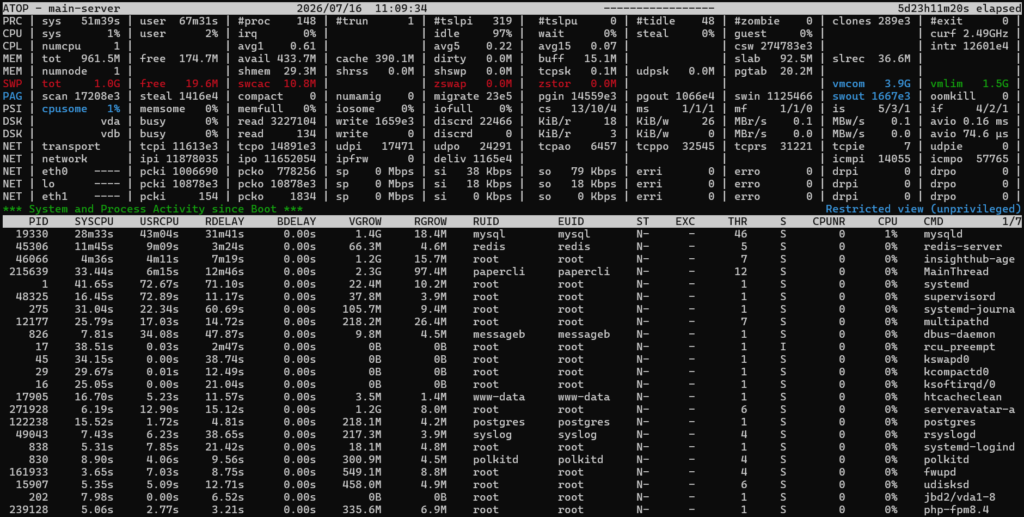
What Information Does atop Display?
atop combines system-wide metrics with process-level statistics.
System Overview
You’ll typically find information about:
- CPU utilization
- Memory and swap usage
- Disk activity
- Network throughput
- System uptime
- Load averages
Process Details
Each running process can display information such as:
| Field | Description |
|---|---|
| PID | Process ID |
| USER | Process owner |
| CPU | CPU time consumed |
| MEM | Memory usage |
| DISK | Disk read/write activity |
| NET | Network usage (where supported) |
| CMD | Executable or command name |
This combination makes atop one of the most comprehensive monitoring tools available from the command line.
Helpful Keyboard Shortcuts
While atop is running, these shortcuts make navigation easier.
| Key | Purpose |
|---|---|
| c | CPU statistics |
| m | Memory statistics |
| d | Disk activity |
| n | Network activity |
| P | Sort by CPU usage |
| M | Sort by memory usage |
| D | Sort by disk usage |
| z | Hide inactive processes |
| q | Exit |
Switching between these views allows you to focus on the resource that’s currently causing performance issues.
When Should You Use atop?
atop becomes especially valuable when you’re troubleshooting issues that don’t happen consistently.
Common examples include:
- A server becomes slow during overnight backup jobs.
- CPU usage spikes only during scheduled tasks.
- Memory usage gradually increases over several hours.
- Disk I/O occasionally becomes saturated.
- Performance complaints occur before administrators are available to investigate.
Because historical data is available, you can often identify the root cause without reproducing the problem.
Choosing the Right Linux Process Monitoring Tool
Each command covered in this guide has its own strengths. Rather than replacing one another, they’re often used together depending on the task.
| Requirement | Recommended Tool | Why It Fits |
|---|---|---|
| Check whether a process is running | ps | Fast snapshot of active processes |
| Monitor CPU and memory live | top | Continuously updates resource usage |
| Search, filter, and manage processes easily | htop | Interactive interface with built-in tools |
| Investigate past performance issues | atop | Historical monitoring and detailed resource tracking |
A practical workflow might look like this:
- Use
psto verify that a service is running. - Switch to
topif you notice high resource usage. - Open
htopfor easier navigation and process management. - Review
atoplogs if the issue happened earlier and you need historical data.
Selecting the right monitoring tool for the task can help you identify and resolve Linux server issues more efficiently.
Best Practices for Monitoring Linux Processes
Regardless of which utility you use, following a few good habits can make troubleshooting more efficient.
Monitor Before Making Changes
Check current resource usage before restarting services or applying updates. Having a baseline makes it easier to determine whether a change improved or worsened performance.
Watch Trends Instead of Single Readings
A brief spike in CPU or memory usage isn’t always a problem. Look for sustained patterns before taking action.
Identify the Root Cause
Avoid terminating processes simply because they’re consuming resources. A busy process may be performing legitimate work, such as handling web traffic or database queries.
Combine Multiple Tools
No single command provides every answer. Using ps, top, htop, and atop together often gives a more complete understanding of what’s happening on your server.
Keep Monitoring Utilities Updated
Newer package versions may include bug fixes, improved compatibility, and additional features that enhance monitoring accuracy.

Common Process Monitoring Problems and Solutions
| Problem | Possible Cause | Suggested Approach |
|---|---|---|
| CPU usage remains high | Resource-intensive application | Sort processes by CPU usage using top or htop. |
| Server feels slow despite low CPU usage | Memory pressure or disk bottlenecks | Review memory and disk activity using htop or atop. |
| A service appears unavailable | Process has stopped unexpectedly | Verify the process using ps and restart the service if necessary. |
| Performance issue already disappeared | Temporary workload spike | Review historical data with atop if logging is enabled. |
| Multiple similar processes are running | Expected worker processes or misconfiguration | Check the parent process and application configuration before making changes. |
Conclusion
Understanding what’s happening inside a Linux system is an essential skill for anyone responsible for servers, applications, or development environments. Whether you’re confirming that a service is running, investigating high CPU usage, or analyzing performance trends over time, the right monitoring tool can help you reach answers much faster.
Instead of relying on a single utility, become comfortable switching between ps, top, htop, and atop based on the situation. Each command offers a different perspective, and together they provide a well-rounded toolkit for diagnosing performance issues and keeping Linux systems running smoothly.
As your infrastructure grows, consistent process monitoring becomes an important part of proactive server management rather than just a troubleshooting step.
FAQs
Is htop better than top?
Neither tool is universally better. htop provides a cleaner, more interactive interface with features like search, filtering, and mouse support, whereas top is pre-installed on most Linux distributions.
Which command is best for checking running processes in Linux?
It depends on what you’re trying to accomplish. Use ps for a quick snapshot, top for live monitoring, htop for an easier interactive experience, and atop when historical performance data is important.
Can I install htop and atop on any Linux distribution?
Most modern Linux distributions provide both packages through their default repositories, although the installation command may differ depending on the package manager.
Which tool uses the least system resources?
The ps command typically has the smallest overhead because it only collects information once and then exits. Interactive tools continuously refresh their displays and therefore consume slightly more resources.
Do I need root privileges to monitor processes?
Many process details are visible to regular users. However, viewing information about system-wide services or managing processes owned by other users may require elevated privileges.
Key Takeaways
- Linux provides multiple tools for monitoring running processes, each designed for different scenarios.
psis ideal for quick process lookups and scripting.topprovides a continuously updated view of system activity.htopsimplifies process monitoring with an interactive interface and built-in management features.atopadds historical performance tracking, making it easier to diagnose intermittent issues.- Choosing the right tool depends on whether you need a snapshot, live monitoring, or historical analysis.
Manage Your Linux Servers More Efficiently with ServerAvatar
Command-line tools are invaluable for inspecting processes and diagnosing performance issues, but day-to-day server administration often involves much more than monitoring resource usage.
Tasks like deploying applications, configuring web servers, managing PHP versions, securing websites with SSL, scheduling backups, and overseeing multiple servers can quickly become time-consuming.
If you’re looking for a simpler way to manage Linux servers without giving up flexibility, ServerAvatar provides a centralized dashboard for handling these routine administration tasks. It complements your command-line workflow, allowing you to spend less time on repetitive management and more time building and maintaining your applications.
About the Author
Meghna Meghwani is a technical writer focused on Linux, Ubuntu, VPS hosting, server management, WordPress, PHP, Node.js, cloud hosting, and DevOps. She creates beginner-friendly tutorials, practical hosting guides, troubleshooting articles, and server security content designed to help developers and businesses manage applications and servers more efficiently.