
There comes a moment, usually at the worst possible time, when your application suddenly crawls. Pages take forever to load, API calls time out, and users start complaining. Knowing how to kill MySQL queries quickly can help restore performance and get your application back on track.
In my experience, the culprit behind most sudden MySQL slowdowns isn’t the server running out of memory or CPU, it’s almost always one or two queries that have gone rogue. A missing index on a frequently queried table. A bulk UPDATE running during peak traffic. A cron job that got stuck in a join it can’t finish.
When that happens, you need to get in, find the problem fast, and fix it, without panicking. The MySQL command-line client gives you everything you need to do exactly that. No third-party tools, no elaborate setup. Just SSH in and you’re already diagnosing.
In this guide, I’m going to walk you through the entire workflow: spotting slow queries, understanding why they’re slow, safely terminating them, and putting safeguards in place so the same problem doesn’t come back an hour later. Sound good? Let’s get into it.
TL;DR
| Key Takeaway | Summary |
|---|---|
| Common causes of slow queries | Slow MySQL queries are often caused by missing indexes, inefficient SQL statements, or long-running transactions that consume database resources. |
| Monitor active database activity | Use SHOW FULL PROCESSLIST to view all active MySQL connections and identify the queries currently being executed. |
| Prioritize by execution time | The Time column helps you quickly spot queries that have been running the longest and may require attention. |
| Analyze before taking action | Run EXPLAIN to understand the execution plan of a slow query before deciding whether it should be terminated or optimized. |
| Use the appropriate kill command | Start with KILL QUERY to stop only the running SQL statement. Use KILL CONNECTION only if ending the entire session is necessary. |
| Confirm successful termination | After stopping a query or connection, execute SHOW FULL PROCESSLIST again to verify that the thread has been removed. |
| Prevent future performance issues | Configure max_execution_time to automatically stop queries that exceed a defined execution time limit, helping protect server performance. |
| Be aware of transaction rollback | Terminating a query can roll back any uncommitted transactions, so always verify the session status and ensure the database remains in the expected state afterward. |
Why Do MySQL Queries Slow Down or Get Stuck?
Before we dive into the command-line tools, it helps to know what you’re actually looking at. Most query performance problems fall into a few predictable categories.
- Missing or unused indexes are the number one cause in my experience. When MySQL has to scan every row in a table to find a match, queries that should take milliseconds suddenly take minutes. This is especially common on tables that grow quickly, say, a logging table that wasn’t indexed on the timestamp column.
- Large result sets are another frequent offender. A query like “
SELECT * FROM orders WHERE status = 'pending'” looks harmless until that table hits a million rows. MySQL will happily try to return all of them, locking rows along the way. - Lock contention happens when two queries try to modify the same row at the same time. InnoDB handles this with row-level locking, but if one transaction holds a lock too long, others queue up behind it. In my testing, I found that a single
UPDATErunning without an index can lock an entire table for 30 seconds or more under moderate load. - Poorly written SQL, nested subqueries, SELECT * in joins, missing WHERE clauses, can also drag a server down. These don’t always show up in development because test data is small. They reveal themselves in production.
The point is: slow queries aren’t random. They follow patterns. Your job at the command line is to spot those patterns quickly.
Connecting to MySQL via Command Line
The first step is getting into MySQL. You’ll need shell access to your server and a MySQL user with the appropriate privileges. For most admin tasks, the MySQL root user is what I reach for, it has full visibility into every connection on the server.
Open your terminal and connect:
mysql -u root -pHere’s what each part means:
mysql: the MySQL command-line client-u root: log in as the MySQL root user (swap in a different user if needed)-p: prompt for the password interactively (never type the password directly in the command, that’s a security risk)
Once you enter your password and hit Enter, you’ll see the MySQL monitor prompt:
mysql>As shown below:

You’re in. Everything from here runs at this prompt. To exit at any time, just type exit or press Ctrl+C.
One thing I always double-check before proceeding: am I connected to the right database server?
If you’re managing multiple MySQL instances (say, a primary and a replica), it’s worth confirming which one you’re on with:
SELECT @@hostname;Small step, but it saves you from killing a query on the wrong server, a mistake I’d rather not make twice.
Viewing Running Processes: SHOW FULL PROCESSLIST
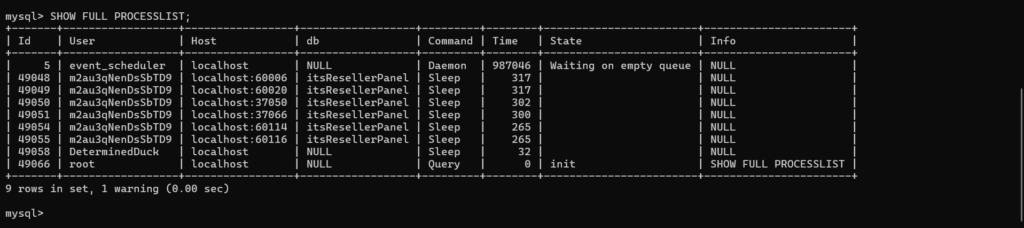
Now that you’re in, the first real diagnostic command is “SHOW FULL PROCESSLIST”. This is your window into everything currently happening inside MySQL.
Run it like this:
SHOW FULL PROCESSLIST;The “FULL” keyword is important; without it, MySQL truncates long queries in the output. You want to see the complete SQL statement, so you know exactly what you’re looking at. The official MySQL documentation covers all the details if you need a reference.
Let me break down the response you will get and why it matters while troubleshooting:
| Column | What it tells you | Why it matters |
|---|---|---|
| Id | The thread’s unique ID number | Used as target when it is needed to kill the query |
| User | MySQL username behind the connection | Helps identify if a query comes from your app, a cron job, or something else |
| Host | Client hostname/IP and port | Narrows down which application server is running the query |
| DB | The default database for this connection | Shows which database is affected; NULL means none specified |
| Command | What the thread is currently doing (Query, Sleep, Binlog Dump, etc.) | Query = actively running SQL; Sleep = idle waiting for new command |
| Time | Seconds the thread has been in its current state | Your fastest filter, high values are red flags |
| State | Granular current state of the thread | Reveals bottlenecks: locks, network writes, table metadata waits |
| Info | The actual SQL query being executed | Copy this to analyze or kill it |
- Id: the thread ID. This is what you’ll use if you decide to kill the query.
- User: the MySQL username behind the connection. This helps you figure out whether a query is coming from your application, a cron job, or something else entirely.
- In my testing, I often see “
app_user” connections spiking while system threads stay quiet, that’s a useful signal.
- In my testing, I often see “
- Host: the hostname or IP address and port of the client. This is particularly helpful when you have multiple application servers.
- If one specific IP is generating dozens of stuck threads, you’ve narrowed your suspect list considerably.
- DB: the default database for this connection. If it’s NULL, the query isn’t using any database specifically, or it’s a system-level command.
- Command: what the thread is currently doing.
Querymeans it’s actively executing SQL.Sleepmeans it’s waiting for a new command.Binlog Dumpmeans it’s feeding data to a replica.- You generally care about
Queryand sometimesConnect.
- Time: this is the column I look at first. It shows how many seconds the thread has been in its current state.
- A query running for 300 seconds is almost certainly a problem.
- A query in
Sleepfor 300 seconds is a different problem, an idle connection that should probably be closed.
- State: gives more detail on what MySQL is doing right now.
- Some states are harmless (
starting,checking permissions). - Others are red flags:
System lock– the query is waiting for a lock held by another thread. This is the most common cause of application hangs I’ve seen in practice.Sending data– MySQL is processing rows and sending them back to the client. If this persists for a long time, the query might be returning a massive result set.Writing to net– Similar to sending data, but specifically network write activity.Waiting for table metadata lock– This one is particularly nasty. It usually means a long-running query is holding a lock that other queries need. Everything queues up behind it.
- Some states are harmless (
- Info: the actual SQL query. This is what you’ll copy when you want to analyze or kill it.
Filtering the Process List
On a busy server, the full output can be overwhelming. There are two ways to narrow it down.
Option 1: Use the command directly
SHOW FULL PROCESSLIST WHERE Time > 60;This shows only threads older than 60 seconds. In my experience, anything over 60 seconds is almost always either stuck or runaway, worth investigating immediately.
Option 2: Query information_schema.PROCESSLIST directly
SELECT id, user, host, db, command, time, state, info
FROM information_schema.PROCESSLIST
WHERE command = 'Query'
ORDER BY time DESC;I use this one often because it lets me sort and filter like a proper SQL query.
Want threads from a specific user?
Add AND user = 'app_user'.
Want only threads touching a specific database?
AND db = 'myapp'. The flexibility is useful when you’re narrowing down a live incident.
One thing to keep in mind: SHOW FULL PROCESSLIST shows you a snapshot. If a query finishes between the time you run the command and the time you read the output, it won’t appear. For fast-moving incidents, I usually run it twice a few seconds apart to make sure I’m looking at the right picture.
Analyzing the Query Before You Kill It
Here’s a step that many admins skip but I think is critical: understand why the query is slow before you kill it.
Killing a query solves the immediate problem, but if you don’t know what caused it, it’ll come back.
The tool for this is EXPLAIN. It shows you MySQL’s execution plan for a query, in other words, how MySQL plans to run your query, not how it’s actually running right now. This distinction matters.
To use it, copy the full query from the Info column and run:
EXPLAIN <your_query_here>;What you’re looking for depends on the query, but there are a few patterns I watch for constantly.
| EXPLAIN Field | What it means | Red flag signal |
|---|---|---|
| type: ALL | Full table scan, every row read | Almost always needs an index |
| key: NULL | No index used at all | Query is scanning everything |
| rows: [high number] | Estimated rows examined | High row count + ALL type = major problem |
| Using filesort | MySQL is sorting results in memory | Warning sign for large result sets |
| Using temporary | MySQL created a temp table for this query | Can be expensive on large datasets |
| filtered: 100 | Every touched row was used | Lower = more rows discarded, possible indexing issue |
- type: ALL means MySQL is doing a full table scan, reading every single row in the table. If you see this on a large table, you almost certainly need an index.
- In my testing, adding a single missing index on a WHERE clause column dropped query time from 45 seconds to under 100 milliseconds on a table with 2 million rows.
- key: NULL with a high
rowscount means no index was used at all. The optimizer looked at the query and decided to just scan everything. That’s a red flag. - Using filesort or Using temporary in the Extra column means MySQL is building a temporary table or sorting results in memory. Fine for small result sets, but a warning sign for large ones.
- filtered: 100 means MySQL is examining every row it touches. Lower percentages mean MySQL is discarding many rows as it goes, a sign that the query logic or indexing could be improved.
Here’s a practical example. Let’s say you pull this from the process list:
SELECT * FROM posts WHERE author_id = 42 ORDER BY created_at DESC;You run EXPLAIN and see:
type: ALL
key: NULL
rows: 480000
Extra: Using filesortThat tells you:
- full table scan
- no index used
- half a million rows examined
- it’s sorting in memory
This query needs an index on author_id (and possibly created_at for the ORDER BY). Killing it buys you time, but adding that index solves it permanently.
What about queries that look fine in EXPLAIN but still run slow?
That’s usually a sign of outdated statistics. Running ANALYZE TABLE <table_name>; refreshes the statistics MySQL uses to choose an execution plan. In some cases, this alone fixes a suddenly slow query.
Killing a Problematic Query: KILL QUERY vs KILL CONNECTION
Once you’ve identified the problem query and understand what it’s doing, it’s time to terminate it. MySQL gives you two options, and choosing the right one matters.
| Command | What it does | When to use it |
|---|---|---|
| KILL QUERY | Terminates only the executing SQL statement; connection stays open | First choice for most situations |
| KILL CONNECTION | Terminates the statement AND drops the client connection | Use when KILL QUERY fails or you need to free the connection slot |
KILL QUERY (Use This First)
KILL QUERY <process_id>;This is the surgical option.
- Stops only the currently executing SQL statement.
- Keeps the database connection active, allowing the client to continue using the same session.
- Prevents the need to reconnect or re-authenticate after the query is terminated.
- Minimizes disruption to applications compared to ending the entire connection.
- Best used as the first approach when dealing with slow or stuck queries.
- The query may not stop immediately if MySQL is completing a disk write or transaction commit.
- In such cases, the thread may remain visible for a few seconds until MySQL reaches a safe interruption point. This behavior is expected.
In my experience, this is almost always the right first move. It’s less disruptive; the application doesn’t have to re-establish a connection, re-authenticate, or deal with a sudden unexpected connection drop.
KILL CONNECTION (Use When Necessary)
KILL CONNECTION <process_id>;This is the brute-force option.
- It terminates both the query and the entire client connection.
- The client will get a “Lost connection to MySQL server” error and will need to reconnect.
I reach for KILL CONNECTION when:
- KILL QUERY didn’t work (the thread persists)
- The connection is in a state where it can’t accept new commands
- I need to free up the connection slot immediately (e.g., during a “Too many connections” crisis)
The downside is that the application may not handle an unexpected connection drop gracefully. In the worst case, you trade a slow query problem for an application error.
What About KILL (Without a Suffix)?
MySQL also accepts just KILL <process_id> without QUERY or CONNECTION. In most MySQL versions, KILL behaves the same as KILL CONNECTION, though the behavior can vary slightly by version. The official MySQL KILL command documentation has the full syntax reference.
To be explicit and avoid ambiguity, I always specify QUERY or CONNECTION explicitly.
Verifying the Kill
After you issue either KILL command, always run SHOW FULL PROCESSLIST again to confirm the thread is gone.
SHOW FULL PROCESSLIST;What you’re looking for:
- the process ID you just killed should either:
- Disappear entirely from the list, or
- Still appear briefly with
Killedin theCommandcolumn
If you see Killed, don’t panic. This means MySQL has registered your kill request but is still cleaning up. The thread will disappear within seconds. If it persists for more than 30 seconds or so, there might be a deeper issue (like a transaction rollback in progress on a large dataset).
If the thread is completely gone, you’re done. Move on to fixing the root cause.
One more thing: if you killed a query that was part of an uncommitted transaction, InnoDB will roll back that transaction automatically.
- This is good, it means your data stays consistent. But it also means any changes that transaction made are undone.
What NOT to Kill: System Threads
This is important enough to call out separately.
When you’re scanning the process list, you’ll see threads from system users. Do not kill these. I cannot stress this enough.
Look for threads with:
User=system userUser=event_schedulerUser= your replication user (oftenreplor similar)
Killing the event_scheduler disrupts scheduled tasks. Killing a replication thread breaks replication, if you’re running a primary-replica setup, this can cause replication lag or complete desync.
The rule I follow:
- If I don’t recognize the user and it’s not my application user, I don’t touch it.
- When in doubt, check the
Hostcolumn. System threads typically haveHostvalues likelocalhostor127.0.0.1with no meaningful client IP behind them.

Preventing the Problem: Proactive Safeguards
Killing queries is firefighting. Here’s how to reduce the frequency of fires.
1. Set max_execution_time
MySQL’s max_execution_time variable sets a maximum duration (in milliseconds) for read-only queries. Any query exceeding this limit is automatically terminated by MySQL, no manual intervention needed.
SET GLOBAL max_execution_time = 30000; -- 30 secondsThis provides an extra layer of protection for production servers and can also be configured on a per-session basis for specific connections.
One caveat: this only applies to read queries by default. Writes have a separate lock_wait_timeout.
2. Add Missing Indexes
After analyzing a slow query with EXPLAIN, you’ll often find that adding an index fixes the problem at its root. For the query we looked at earlier:
ALTER TABLE posts ADD INDEX idx_author_id (author_id);In my testing on a table with millions of rows, adding a single missing index dropped query time by 99%+. It’s usually the highest-ROI optimization you can make.
3. Optimize Queries with EXPLAIN
Even for queries that aren’t currently slow, running EXPLAIN periodically is good hygiene.
Look for full table scans (type: ALL), missing indexes (key: NULL), and filesort operations. Fix the worst offenders before they become incidents.
4. Use Connection Pooling
Idle connections sitting around with no query running still consume a connection slot. If your application opens too many connections and leaves them idle, you’ll hit “Too many connections” even when no queries are actually running.
Connection pooling (via your application or a proxy like ProxySQL) helps manage this.
Conclusion
Being able to identify and terminate problematic MySQL queries from the command line is an essential skill for maintaining database performance. When slow or stuck queries impact your application, quickly inspecting the process list, analyzing the query, and stopping it when necessary can help restore normal operations with minimal downtime.
However, stopping a query is only a short-term solution. To prevent recurring issues, investigate the root cause by reviewing the execution plan with EXPLAIN, optimizing SQL statements, adding appropriate indexes, and configuring query execution time limits.
If you’re managing multiple servers and want a visual dashboard for managing and monitoring servers, applications, and databases, spotting queries, a platform like ServerAvatar can handle a lot of that heavy lifting for you. But even with the best tools, understanding what’s happening under the hood at the command line makes you a far more effective administrator.
FAQs
How do I find queries running longer than a specific time?
Query the information_schema.PROCESSLIST table directly:
SELECT id, user, time, state, info FROM information_schema.PROCESSLIST WHERE command = 'Query' AND time > 60 ORDER BY time DESC;
This returns all active queries older than 60 seconds, sorted so the longest-running query appears first. Adjust the 60 threshold based on your needs.
What is the difference between KILL QUERY and KILL CONNECTION?
KILL QUERY terminates only the currently executing SQL statement, the client connection stays open, and the client can send a new query. KILL CONNECTION drops the entire client connection, forcing the client to reconnect.
Always try KILL QUERY first; use KILL CONNECTION as a fallback when KILL QUERY doesn’t work or you need to free the connection slot immediately.
Can killing a query cause data loss?
Generally no, if you’re using InnoDB (the default storage engine), killing a query mid-execution causes the current transaction to roll back. Your committed data stays safe. However, any uncommitted changes within the killed transaction are undone. Always verify the thread status with SHOW FULL PROCESSLIST after killing to confirm the rollback completed.
My query shows “Killed” in the process list, but it is still there. What do I do?
Wait, MySQL needs time to roll back uncommitted transactions and release resources. On large datasets, this can take 30 seconds or more. If the thread persists beyond a minute, try escalating to KILL CONNECTION <process_id> instead.
If it still doesn’t clear, there may be a deeper issue with the storage engine or lock manager that requires further investigation.
Is SHOW PROCESSLIST safe to run on a production server?
Yes, it’s a read-only diagnostic command that doesn’t acquire locks or modify any data. The only minor consideration is that on extremely busy servers with thousands of connections, the output can be lengthy.
Use WHERE clauses or query information_schema.PROCESSLIST directly to filter results without scanning everything.
Key Takeaways
- SHOW FULL PROCESSLIST is your real-time window into MySQL, use it to spot slow or stuck queries instantly
- The Time column is your fastest filter, queries with high Time values need immediate attention
- Always run EXPLAIN on a problematic query to understand why it’s slow before killing it
- Use KILL QUERY first, it’s the safer option that doesn’t drop the client connection
- Escalate to KILL CONNECTION only when KILL QUERY doesn’t work or you need to free the connection slot entirely
- After killing, verify with SHOW FULL PROCESSLIST again, look for the thread disappearing or showing
Killedtemporarily - Never kill system threads (event_scheduler, replication users), the consequences can be severe
- Set max_execution_time as an automatic safety net so runaway queries can’t monopolize resources
- Root cause analysis matters, killing buys time, but fixing the query (indexes, query structure) solves it permanently
Want simpler server management without switching between the terminals?
Sign up and start a free trial to explore how ServerAvatar simplifies server management and monitoring, making it easy to configure settings, manage services, and perform routine administrative tasks from a user-friendly dashboard.
About the Author
Meghna Meghwani is a technical writer focused on Linux, Ubuntu, VPS hosting, server management, WordPress, PHP, Node.js, cloud hosting, and DevOps. She creates beginner-friendly tutorials, practical hosting guides, troubleshooting articles, and server security content designed to help developers and businesses manage applications and servers more efficiently.