


If you’ve managed web servers or applications for any length of time, you’ve probably seen this happen: a new feature or campaign goes live, traffic suddenly spikes, and Website Load Testing becomes critical when your website starts returning 503 errors at exactly the moment you need it to perform.
What happens next is usually a scramble, SSH into a server you haven’t checked in months, inspect running processes, restart services, and make infrastructure changes based on guesswork. Eventually, the traffic settles, the site recovers, and the immediate crisis is over.
But that kind of incident is often preventable. Load testing helps you find your website’s limits before your users do.
In this guide, we will cover what load testing is, why it matters at every scale, how to run your first test using loader.io (the most accessible free tool available), what your results actually mean, how to find and fix bottlenecks, and how to make load testing a normal part of how you ship software.
TL;DR
- Load testing answers one critical question: how many concurrent users can your server handle before it falls over?
- Without it, you’re guessing about capacity, and guessing wrong right when it matters most
- loader.io is the simplest free tool to get started: no install, browser-based, generous free tier
- Your three essential numbers: concurrent user target, response time threshold, and peak traffic window
- Run load tests before every major deployment, not after your site goes down
What Load Testing Actually Is
Let me clear up some confusion first, because “load testing” gets thrown around interchangeably with a few related terms that mean different things.
Load testing is specifically about simulating concurrent users hitting your site and measuring how your server behaves under a expected load. You’re asking: “When 500 people are on this site at the same time, what happens?”
Stress testing pushes beyond that, you keep adding users until something breaks, then you figure out exactly where the ceiling is. Soak testing holds a sustained load over hours or days to catch memory leaks or database connection pool exhaustion that only shows up over time.
Most small teams skip all of this and call it “load testing” when they open the site in three different browsers and hit refresh a few times. That’s not load testing. That’s optimism.
This distinction is important because each testing approach is designed to answer a specific performance question:
- Load test: “Can the website reliably handle its expected peak traffic?”
- Stress test: “At what point does this fall over, and what breaks first?”
- Soak test: “Can the system maintain stable performance during prolonged, normal traffic without gradual degradation?”
A complete performance testing strategy should consider load, stress, and soak testing. For this guide, we’ll focus on load and stress testing since those are where most teams see the biggest gap in understanding.
Why Most Teams Skip It
I get it. Load testing feels like a luxury. You have a small server, modest traffic, and a product that’s still finding its feet. Why simulate load when you barely have any real load to speak of?
Here’s the uncomfortable truth: load testing is most valuable precisely when you can’t afford for things to go wrong. A startup that goes down during a product launch doesn’t get a second impression. A growing SaaS that crashes right when a customer is about to upgrade has just handed that customer a reason to reconsider.
The teams that skip load testing aren’t avoiding work, they’re accumulating risk. VPS that handles your blog fine today might handle 10x traffic fine too, or it might fall over at 3x. You genuinely don’t know until you test.
What load testing gives you that nothing else can:
- A real number for capacity. Not a guess. Not a “probably fine.” An actual number of concurrent users your setup can handle before performance degrades past an acceptable threshold.
- The location of your bottleneck. Is it the database? The application code? The web server config? The network? A load test with proper instrumentation tells you where things back up.
- A baseline before you change anything. If you optimize your database queries and then run a load test, you have before-and-after data.
- Confidence to scale. When you know your current ceiling, you know exactly when to provision more resources, and you can do it before an incident, not during one.
Setting Your Performance Targets: The Three Numbers That Matter
Before you run any test, you need to define what “passing” looks like. This is where a lot of teams get stuck, they run a load test and get a wall of graphs and don’t know what any of it means.
Here’s what you’re actually looking for:
1. Your concurrent user target
This is the number of simultaneous active users your site needs to handle at peak. Not total daily visitors, active users. Someone who has the page open and is interacting with it.
A practical way to estimate this: take your peak hour’s pageviews, divide by 60 to get per-minute, then multiply by your average session duration in minutes. If you get 6,000 pageviews in your busiest hour and sessions average 3 minutes, that’s roughly 300 concurrent users at peak.
If you don’t have analytics that can give you this, err on the side of 2x what you’ve seen. You can always calibrate after your first real test.
2. Your response time threshold
What response time is acceptable for your application? Define it in milliseconds and be specific.
For a static blog, 3 seconds might be perfectly fine. For a SaaS dashboard where users are actively working, anything over 1 second feels sluggish. For an e-commerce checkout flow, 2 seconds is a reasonable ceiling. For an API, you might need sub-200ms.
Write this number down before you test. It becomes your pass/fail criterion. Without it, any result can be interpreted as either a pass or a failure depending on your mood that day.
3. Your peak traffic windows
Map when your traffic actually spikes. Email campaigns, social posts, scheduled jobs, and API batch processes create load patterns. A test that runs at 3 AM when traffic is low tells you nothing about your morning peak.
Once you know these three things, your concurrent user target, your response time threshold, and your peak windows, you have a test brief. Everything else is execution.
Why loader.io Is the Best Starting Point
There are a dozen load testing tools. k6, Apache Benchmark, Locust, JMeter, Gatling, Blitz, each has strengths. For teams getting started, loader.io is the right choice for one reason: friction.
It runs in a browser. There’s nothing to install. You don’t need a separate machine, a command-line interface, or a paid subscription to get meaningful results.
That’s the free tier has limits: enough to establish your baseline, not enough for daily regression testing in production. For that, you would eventually have to move to another tool or paid plan. But as a starting point, loader.io removes every excuse to not test.
Now that we understand what load testing is and why it matters, let’s put it into practice. In the following steps, we’ll use loader.io to create a test, configure realistic traffic, run the test, and analyze the results to understand how your website performs under load.
How to Perform a Website Load Test
Now that you know the fundamentals of website load testing, it’s time to test your own application. Let’s walk through the process step by step.
Step 1: Create Your loader.io Account
Start by creating an account on loader.io
- Visit the loader.io website and select Sign Up Now.
- Enter the required information, such as:
- Company name
- Email address
- Password
- Complete the registration process.
- Check your inbox for the verification email.
- Click on the Verify link in your inbox to activate your account.
- Once your email is verified, log in to access the loader.io dashboard.
Note: Email verification is required before you can create and run load tests.
Step 2: Add the Website You Want to Test
Before generating traffic, loader.io needs to know which website or application should receive the test requests. In loader.io:
- Open the dashboard.
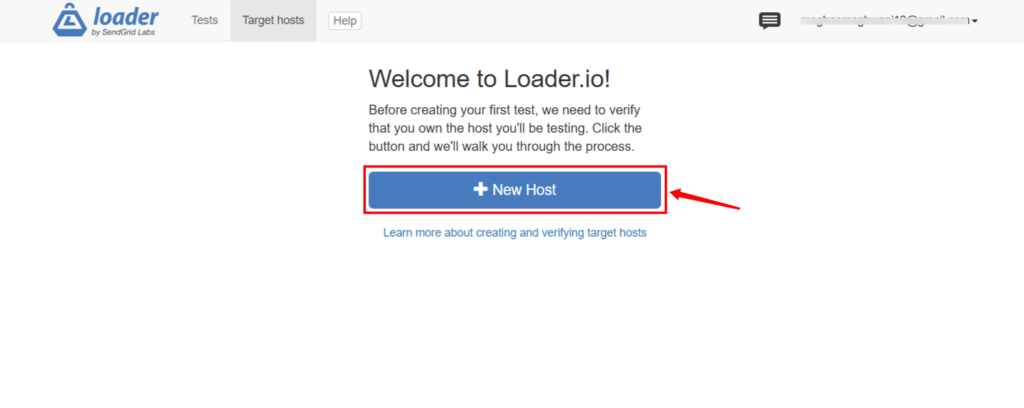
- Click “+ New Host“.
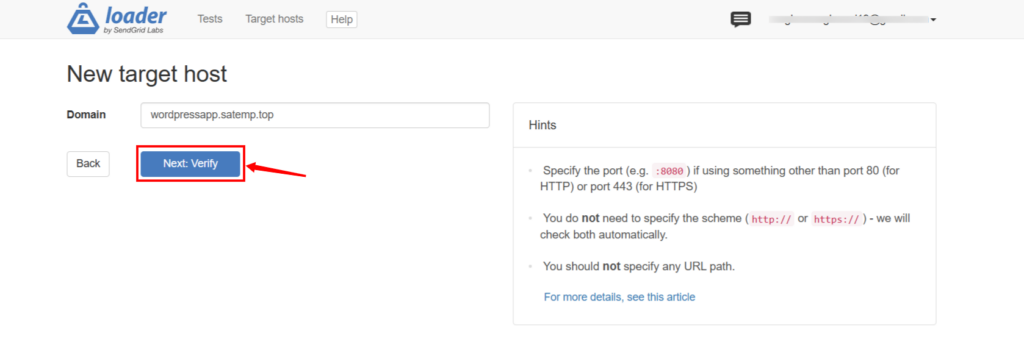
- Enter the domain you want to test.
- Use the exact domain or subdomain you want to evaluate.
For example:
yourdomain.comor:
blog.yourdomain.comBefore adding a host, keep these points in mind:
- Test only websites or servers that you own or are authorized to test.
- Make sure the domain is accessible over the internet.
- Choose the specific application or subdomain you want to measure.
- Domain ownership verification is required before traffic testing can begin.
This verification process helps prevent unauthorized load testing against third-party websites.
Step 3: Verify Domain Ownership
loader.io provides domain verification methods that confirm you have permission to test the selected website. The two common approaches are:
- HTTP verification
- DNS verification
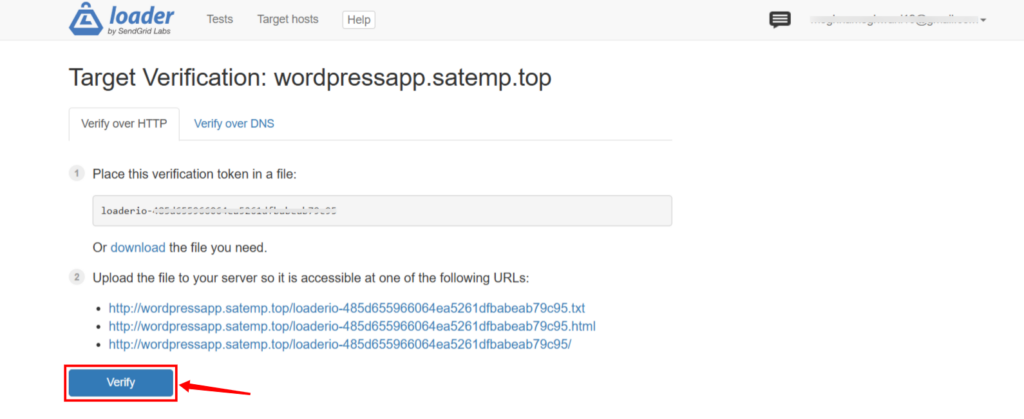
1. HTTP Verification
HTTP verification is generally straightforward for website owners. The process typically involves:
- Create or add your host in loader.io.
- Download or copy the verification file provided by loader.io.
- Upload the file to your website’s document root.
- Make sure the file is publicly accessible.
- Return to loader.io and select Verify.
For example, the verification file may look similar to:
loaderio-abc123def456.txtFor a WordPress website, the file usually needs to be placed in the directory containing:
wp-admin
wp-content
wp-includesIf Your Website Is Hosted on ServerAvatar
You can upload the verification file through your application’s file management tools:
- Log in and open your ServerAvatar dashboard.
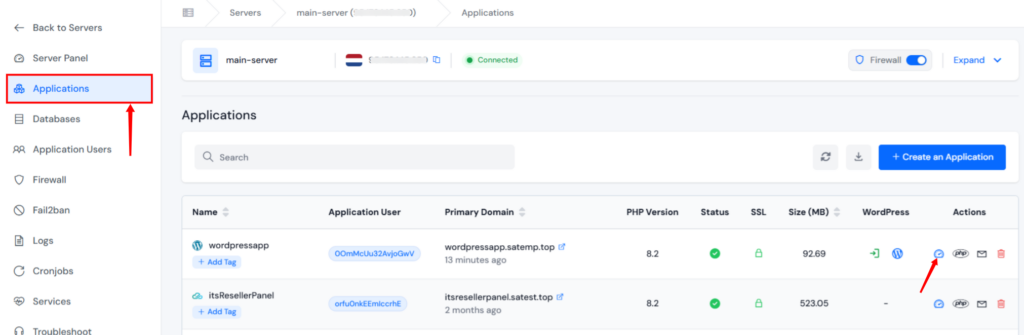
- Navigate to your server panel by clicking on the server dashboard icon.

- Navigate to the Application panel and click on the application dashboard icon for your relevant application.
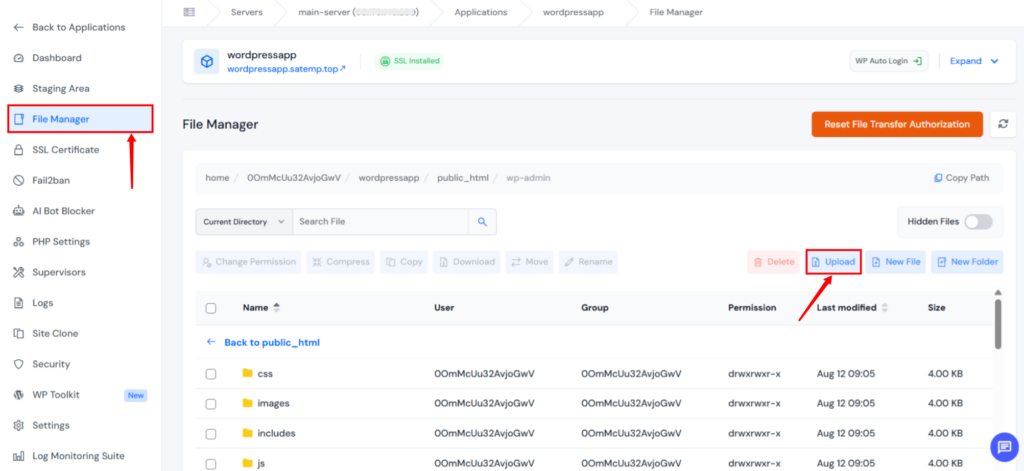
- Navigate to the File Manager section. Navigate to the application’s root directory.
- Upload the loader.io verification file using the Upload button.
- Return to loader.io and complete the verification.
2. DNS Verification
If you don’t want to upload a file, DNS verification is another option.
- Open your domain’s DNS management panel.
- Add the TXT record provided by loader.io.
- Save the DNS changes.
- Return to loader.io.
- Complete the verification process.
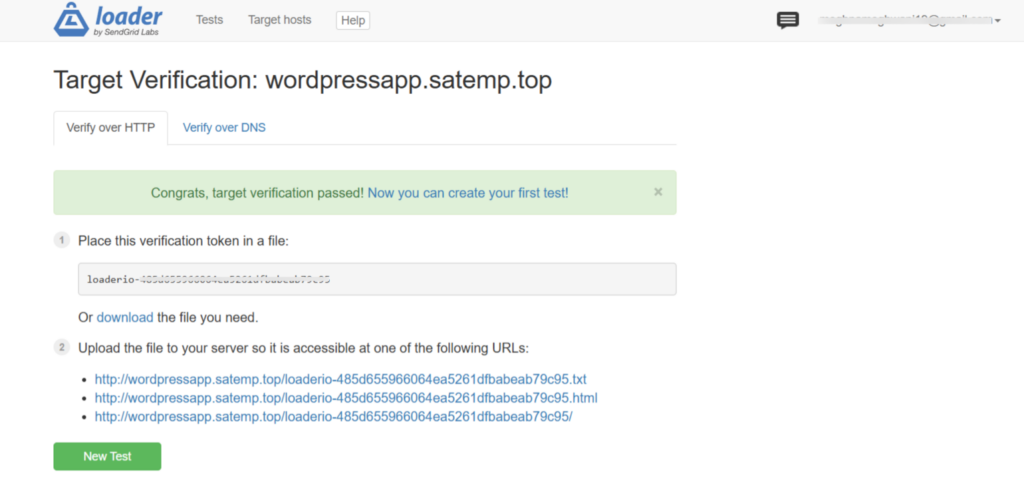
Once loader.io confirms ownership, the host becomes available for load testing.
Step 4: Configure Your First Load Test
After verifying your host, create your first test by selecting New Test from the loader.io dashboard. You’ll need to configure several parameters.
Important Test Settings:
- Test Name: Use a descriptive name that makes future comparisons easier.
- Example:
Homepage Baseline - 300 Users
- Example:
- Test type: Select Clients per test.
- This means Loader.io will use a total of 300 clients during the test.
- Clients: 300
- Duration: 1 Min.
- Client Request
- Method:
GET - Protocol:
HTTP - Host:
wordpressapp.satemp.top
- Method:
- Leave other variable fields empty unless your application specifically requires them.
- Click Run test.
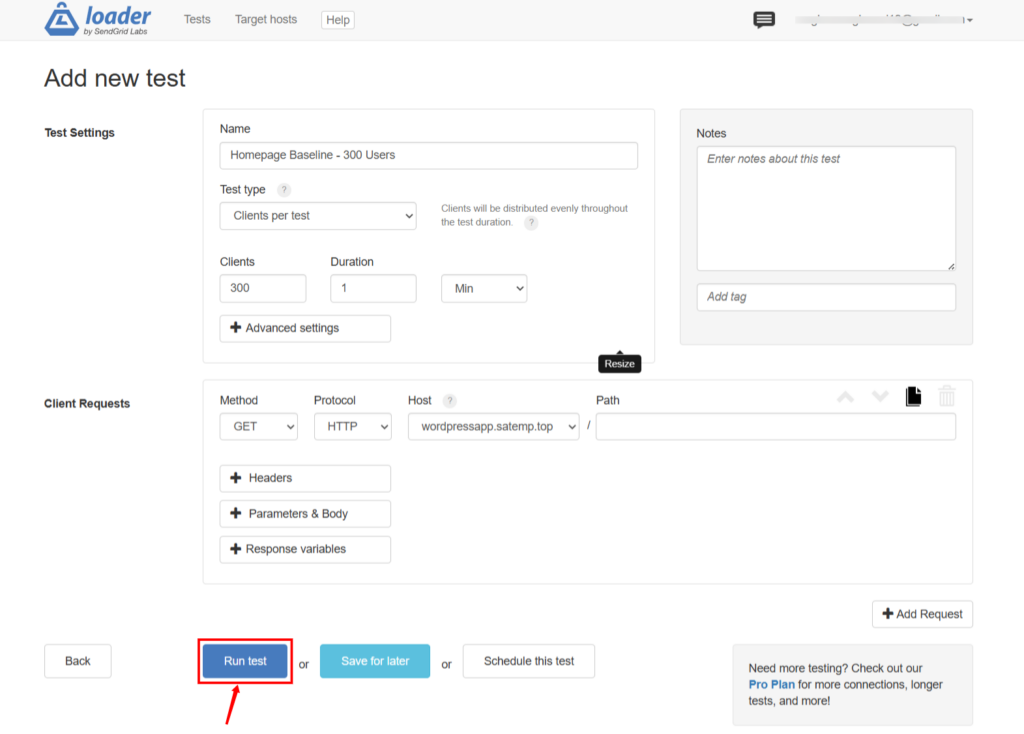
Example Baseline Configuration
| Field | What to enter (Example) |
|---|---|
| Name | Homepage Baseline - 300 Users |
| Test type | Clients per test |
| Clients | 300 |
| Duration | 1 |
| Duration unit | Min |
| Method | GET |
| Protocol | HTTP |
| Host | wordpressapp.satemp.top |
| Path | / |
Why Start Small?
Don’t immediately test your server at extreme traffic levels. A gradual approach is safer:
- Establish a baseline.
- Test your expected traffic level.
- Increase the load progressively.
- Monitor response times and errors.
- Stop increasing traffic when you identify a performance limit.
This approach makes it easier to determine where a bottleneck begins.
Step 5: Analyze the Load Test Results
The test results are more useful when you look at multiple metrics together rather than focusing on a single number.
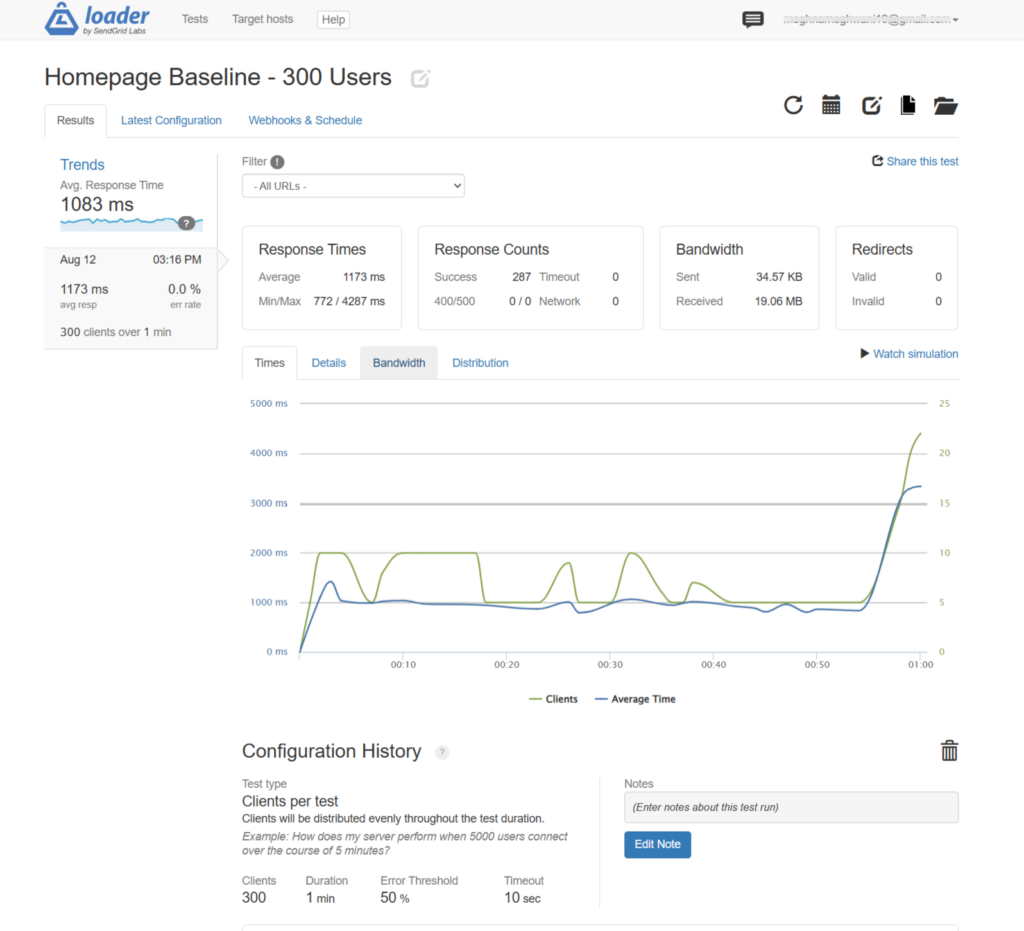
1. Response Time
Response time shows how long your application takes to respond to requests.
The graph shows that response time remained around 1 second for most of the test, but increased sharply near the end, reaching more than 3 seconds and with a recorded maximum of 4.287 seconds.
This suggests that the application was reasonably consistent initially, but response performance degraded as the load increased.
2. Error Rate
A low error rate is an important indicator of application stability. The test produced an error rate of 0.0%, which is a positive result.
The response counts show:
| Metric | Result |
|---|---|
| Successful responses | 287 |
| Timeout | 0 |
| Network errors | 0 |
| HTTP 400 errors | 0 |
| HTTP 500 errors | 0 |
| Error rate | 0.0% |
This means there were no reported HTTP 4xx/5xx errors, connection timeouts, or network errors during the test.
Therefore, the application remained stable under this particular 300-client, 1-minute test.
3. Performance Degradation
During most of the test, the average response time stayed close to 1,000–1,200 ms. Toward the end of the one-minute test, response time increased substantially.
This gives the following interpretation:
- Initially: Response time was relatively stable at around 1 second.
- As load increased: Response time began fluctuating.
- Near the end: Response time increased sharply, reaching several seconds.
- Maximum: A response time of 4,287 ms was recorded.
- Errors: No errors appeared despite the increase in response time.
Example Interpretation
| Result from Test | Possible Interpretation |
|---|---|
| Average response time: 1,173 ms | Application response time is around 1.17 seconds on average |
| Min: 772 ms | Fastest observed response was approximately 0.77 seconds |
| Max: 4,287 ms | Some requests became significantly slower |
| 0.0% errors | No HTTP, timeout, or network errors were reported |
| 287 successful responses | 287 successful responses were recorded during the 1-minute test |
| ≈4.8 responses/sec | Approximate throughput based on 287 responses over 60 seconds |
| Response time rises near test end | Possible resource/concurrency pressure |
| No 400/500 errors | Application remained functionally stable during the test |
| 19.06 MB received | Approximately 19 MB of response data was transferred |
| 34.57 KB sent | Approximately 34.57 KB of request data was sent |
Overall Interpretation
The 300-client baseline test completed successfully with a 0.0% error rate, which indicates good basic stability. However, the average response time of 1.173 seconds and especially the 4.287-second maximum response time show that performance was not completely consistent.
The most important observation is the sharp increase in response time near the end of the test. Before increasing server resources, it would be useful to monitor CPU, memory, PHP workers, database performance, and web-server limits during another load test to determine what is causing the slowdown.
Finding Your Performance Bottleneck: A Practical Debugging Sequence
A load test tells you that something is slow. It doesn’t automatically tell you why. For that, you need server diagnostics during the test. Here’s the sequence I use when a load test reveals a problem:
1. Check CPU and memory during the test
SSH into your server while the load test is running and watch resource usage. On Ubuntu:
htopLook for CPU utilization, Memory consumption, Swap usage, PHP processes, Web server processes, and processes consuming unusually high resources
If CPU usage is consistently high;
Possible causes include:
- Inefficient application code
- Expensive PHP operations
- Database queries
- Insufficient CPU resources
- Too many concurrent processes
If memory usage is high;
Investigate:
- PHP worker count
- PHP memory limits
- OPcache configuration
- Database memory usage
- Swap activity
2. Check your PHP-FPM configuration
For WordPress and PHP applications, PHP-FPM is the most common source of load testing failures. Its process pool has hard limits, and those limits are often set conservatively by default.
The key settings in /etc/php/8.x/fpm/pool.d/www.conf:
pm.max_children = 10          # Maximum number of child processes
pm.start_servers = 2          # Processes created at startup
pm.min_spare_servers = 1      # Minimum idle processes
pm.max_requests = 500 # Recycle children after this many requestsIf pm.max_children is set to 10 while traffic reaches 300 concurrent users, requests may queue or fail. Increasing the limit can improve concurrency, but make sure your server has enough RAM to handle the additional PHP processes.
3. Check your Nginx worker connections
In /etc/nginx/nginx.conf:
worker_connections 1024;
worker_processes auto;Each Nginx worker can handle the number of connections set by worker_connections.
With worker_connections 1024 and worker_processes auto, Nginx can handle a large number of concurrent connections. However, setting worker_processes too low on a multi-core server can limit performance and leave available CPU capacity unused.
4. Check database connections
If your load test errors include database connection timeouts, your database is the bottleneck. Check your MySQL/MariaDB max_connections setting:
SHOW VARIABLES LIKE 'max_connections';The default database connection limit is often around 151, but PHP-FPM workers can quickly consume available connections. If too many requests arrive at once, the database may reach its limit, causing new connections to queue or fail.
5. Check your disk I/O
On servers with slower storage, heavy database activity can saturate disk I/O before CPU or RAM becomes a bottleneck. High I/O wait with low CPU usage is a common sign. Solutions include upgrading to NVMe storage, increasing RAM, optimizing database queries, or using read replicas for heavy workloads.
Running Tests That Actually Tell You Something
I’ve watched teams run load tests that generated impressive dashboards and taught them nothing. Here’s what separates useful tests from decorative ones.
Test your actual peak pages, not just the homepage
A homepage may handle high traffic easily, while database-heavy pages such as /product/search can slow down under much lower traffic. Focus your load tests on the pages and endpoints that are most critical to your users and business.
Run tests from a location close to your users
Run load tests from regions close to your primary users to get more realistic results. If your users are mainly in Europe, testing from a distant region may add unnecessary network latency. Choose test locations based on your actual traffic distribution whenever possible.
Always have a before measurement
A single load test only shows performance at one point in time. Run a baseline before major changes such as upgrading PHP, switching web servers, adding a CDN, or modifying database settings. Test again afterward and compare the results to measure whether the change actually improved performance.
Test at realistic times
Running a load test against a server that’s also processing a database migration, a log rotation, or a backup job gives you contaminated data. Close the loop on background jobs before you test.
Integrating Load Testing Into Your Deployment Workflow
The worst time to discover a performance regression is right after you’ve shipped. The best time is in your CI/CD pipeline, before the code ever reaches production.
The practical integration doesn’t need to be complex. Here’s a lightweight approach:
For teams using GitHub Actions and loader.io:
You can integrate loader.io into your CI/CD workflow to run performance tests automatically. Generate an API token from your loader.io account, store it securely as a GitHub repository secret, and configure a GitHub Actions workflow to trigger tests and review the results.
name: Load Test
on:
  push:
    branches: [main]
  workflow_dispatch:

jobs:
  load-test:
    runs-on: ubuntu-latest
    steps:
      - name: Trigger loader.io test
        run: |
          curl -X POST https://api.loader.io/v3/tests/${{ secrets.LOADER_TEST_ID }}/run \
            -H "Authorization: Token ${{ secrets.LOADER_API_TOKEN }}" \
            -H "Content-Type: application/json"

      - name: Wait and check results
        run: sleep 90 && curl https://api.loader.io/v3/tests/${{ secrets.LOADER_TEST_ID }}/results/latest \
-H "Authorization: Token ${{ secrets.LOADER_API_TOKEN }}"For teams without CI/CD:
Even without a CI/CD pipeline, you can maintain consistent performance monitoring by running manual load tests at regular intervals, such as once a week. Record the key results after each test and compare them over time to identify performance improvements, regressions, or capacity issues.
Reviewing the data monthly can also help you understand how infrastructure or application changes affect overall performance. Load Test Tracking Spreadsheet as mentioned below:
| Date | Test Name | Clients/Min | Duration | p95 (ms) | Error Rate | Notes |
|---|---|---|---|---|---|---|
| 12-Aug-2026 | Homepage Baseline | 300 | 1 min | 650 | 0% | Initial test |
| 19-Aug-2026 | Homepage Baseline | 300 | 1 min | 580 | 0% | Cache optimized |
| 26-Aug-2026 | Homepage Baseline | 500 | 2 min | 720 | 0.5% | Increased traffic |
When loader.io Isn’t Enough: Other Tools Worth Knowing
loader.io is the right tool for your first load tests and for most ongoing baseline testing. But as your application grows, you’ll hit the edges of what a browser-based tool can do.
k6 (Grafana k6): k6 is an open-source load-testing tool that uses JavaScript to create flexible test scenarios. It works well for API testing, realistic user flows, CI/CD automation, and performance monitoring through Grafana.
A basic k6 script looks like this:
import http from 'k6/http';
import { check, sleep } from 'k6';

export const options = {
  vus: 300,
  duration: '2m',
  thresholds: {
    http_req_duration: ['p(95)<800'],
    http_req_failed: ['rate<0.01'],
  },
};

export default function () {
  const res = http.get('https://yourdomain.com');
  check(res, {
    'status is 200': (r) => r.status === 200,
    'p95 under 800ms': (r) => r.timings.duration < 800,
  });
  sleep(1);
}Run it with k6 run load-test.js. k6 returns a non-zero exit code when your thresholds fail, which makes it work natively in CI/CD pipelines.
Apache Benchmark: Installed on almost every Linux system by default. The quick, dirty, no-setup way to get a basic RPS and response time number:
ab -n 10000 -c 500 https://yourdomain.com/This command sends 10,000 requests with 500 concurrent connections to quickly assess basic performance. The results are useful for a simple sanity check, but the tool doesn’t simulate realistic user behavior or complex workflows, so consider it a basic performance check rather than a full load test.
Locust: Locust is a Python-based load-testing tool designed for distributed testing. It allows you to create custom user scenarios in Python and generate traffic across multiple machines. While it requires more setup than k6, it’s a strong option for teams working with Python-based applications.

What to Do After You Find Your Breaking Point
A load test reveals your limit. What you do next depends on what you find.
Optimize first. Before upgrading your server, identify configuration or application-level bottlenecks. Optimizations such as PHP OPcache, database caching, FastCGI caching, and PHP-FPM tuning can improve performance with minimal cost. Re-run your load test after each change to measure the actual improvement.
Scale vertical before horizontal. If your application is reaching its resource limits, consider upgrading the server’s CPU or RAM before adding multiple servers. A well-configured VPS can handle significant traffic, while horizontal scaling adds architectural complexity and is better suited to specific scalability and availability requirements.
Know your ceiling and plan around it. If testing shows your server can reliably handle 400 concurrent users but an upcoming launch may generate 2,000, the solution is proper capacity planning. Scale your infrastructure in advance, test it under the expected load, and make sure everything is ready before the launch.
Common Mistakes That Make Load Tests Misleading
Testing from the same server you’re testing. Your load test tool running on the same machine you’re testing means the tool itself consumes resources from the server it’s measuring. Run the test from your local machine, a CI runner, or a separate test machine.
Testing at the wrong time. A load test run at 3 AM when automated backups are running, log rotations are processing, and cron jobs are active gives you noisy data. Test during your normal operating window.
Setting unrealistic targets. Demanding that a $10/month VPS handle 5,000 concurrent users at 200ms response time isn’t a load test, it’s a budget mismatch. Set targets that match your infrastructure. A 2-second response time for a content site at 400 concurrent users is a perfectly reasonable goal.
Celebrating a passing test without context. If your first load test passes, that’s not the end of the analysis, it’s the beginning. What happens at 2x your target? At 5x? Run the stress test to know your ceiling. A passing load test at your current load tells you you’re ready for today. A passing stress test tells you you’re ready for growth.
Key Takeaways
- Load testing helps you find performance limits before real users experience slowdowns or downtime.
- Define clear performance goals for concurrent users, response time, and peak traffic before testing.
- Start with a baseline test and gradually increase traffic to identify when performance begins to degrade.
- Monitor more than response time, track error rates, RPS, CPU, RAM, PHP-FPM, database connections, and disk I/O.
- Use loader.io for quick and accessible testing, especially when you’re getting started with load testing.
- Test important pages and user journeys, not just your homepage.
- Compare results before and after optimizations to measure whether configuration or code changes actually improve performance.
- Automate load testing where possible using tools such as k6 and CI/CD workflows.
- Know your server’s capacity ceiling so you can scale resources before traffic exceeds what your infrastructure can handle.
- Make load testing part of your regular workflow, rather than waiting for a traffic spike or production outage to reveal performance problems.
Conclusion
Load testing takes the guesswork out of website performance. By simulating realistic traffic, monitoring response times and errors, and checking server resources, you can identify bottlenecks before they affect real users. Starting with a simple tool like loader.io makes it easier to establish a reliable performance baseline.
The goal isn’t simply to find out when your website breaks. It’s to understand your capacity, improve weak points, and plan for future traffic with confidence. Run tests regularly, compare results after major changes, and scale your infrastructure before demand exceeds its limits.
FAQs
How many users should I use for a load test?
Start with your expected peak concurrent users and gradually increase the load. Avoid jumping directly to extremely high traffic levels, as gradual testing makes it easier to identify where performance begins to degrade.
What metrics should I monitor during a load test?
The most useful metrics include response time, p95 latency, error rate, requests per second (RPS), CPU usage, memory usage, PHP-FPM processes, database connections, and disk I/O.
How often should I perform load tests?
Run a baseline test before major infrastructure or application changes. For websites where performance is important, scheduled weekly or monthly tests can help track performance trends over time.
Can I perform load testing on a production website?
You can, but it should be carefully planned and authorized. Aggressive tests may consume significant server resources and affect real visitors. When possible, use a staging environment for high-intensity testing.
What does a high response time during a load test mean?
Increasing response times can indicate that your application or server is approaching a resource limit. Check CPU, RAM, PHP-FPM workers, database performance, web-server configuration, and disk I/O to identify the underlying bottleneck.
About the Author
Meghna Meghwani is a technical writer focused on Linux, Ubuntu, VPS hosting, server management, WordPress, PHP, Node.js, cloud hosting, and DevOps. She creates beginner-friendly tutorials, practical hosting guides, troubleshooting articles, and server security content designed to help developers and businesses manage applications and servers more efficiently.