
Keeping a Linux server healthy is not just about setting it up and hoping for the best. Servers run applications, databases, background tasks, and web services every second, which makes continuous visibility essential. With New Relic Monitoring, administrators can track system performance, detect slowdowns, and identify issues before they turn into outages. If something slows down or breaks, you need to know what happened and why it happened quickly.
This is where New Relic monitoring becomes extremely useful. New Relic helps you monitor your Linux server’s performance in real time. It shows CPU usage, memory consumption, disk activity, network traffic, and much more, all from a single dashboard. With proper monitoring in place, you can detect problems early, troubleshoot faster, and keep your applications running smoothly.
In this guide, we’ll explain how to install New Relic monitoring on a Linux server in simple terms.
What Is New Relic and Why Use It on Linux?
New Relic is an observability and monitoring platform used by developers and system administrators worldwide.
On Linux servers, it helps you:
- Track CPU, RAM, disk, and network usage
- Monitor system load and resource bottlenecks
- Identify performance issues before users notice them
- Get alerts when something goes wrong
- View all metrics in a clean, visual dashboard
Whether you manage a single VPS or multiple production servers, New Relic gives you better visibility into what’s happening behind the scenes.
Prerequisites Before Installing New Relic
Before starting the installation for New Relic, make sure to check the prerequisites:
- A Linux server (Ubuntu, Debian, CentOS, Rocky Linux, etc.)
- Root or sudo access to the server
- A New Relic account (free or paid)
- Internet access from the server
If these basics are ready, you can move forward confidently.
Step 1: Create a New Relic Account
Let’s start by creating a new account for installing New Relic on your server. No need to worry about any charges to pay as the free plan is perfectly suitable for initial bases.
- Once you have created an account, log in to your New Relic dashboard
Step 2: Monitoring Method
- Navigate to the Integrations & Agents section from the left sidebar.
- Select PHP as a Data source.
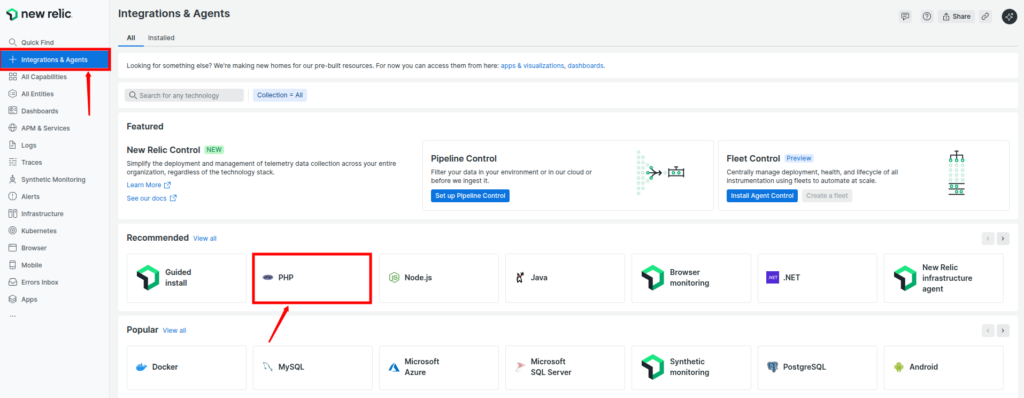
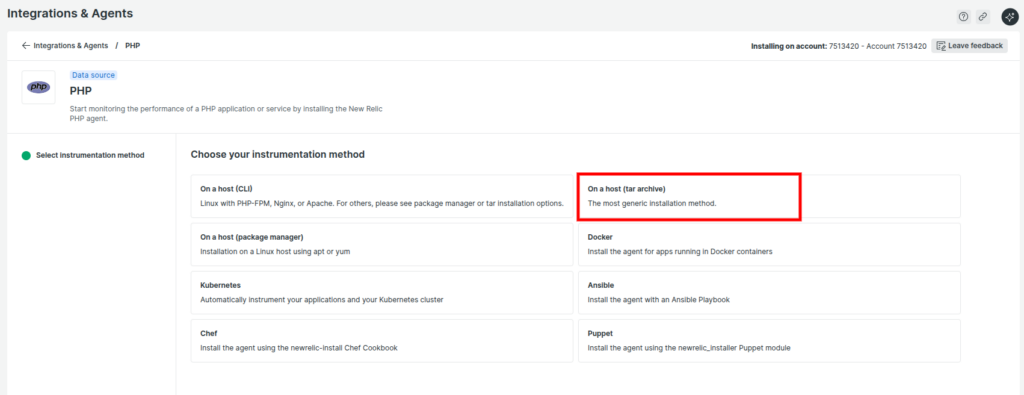
- You need to select your data collection method. Select On a host (tar archive) option from the given to monitor your server.
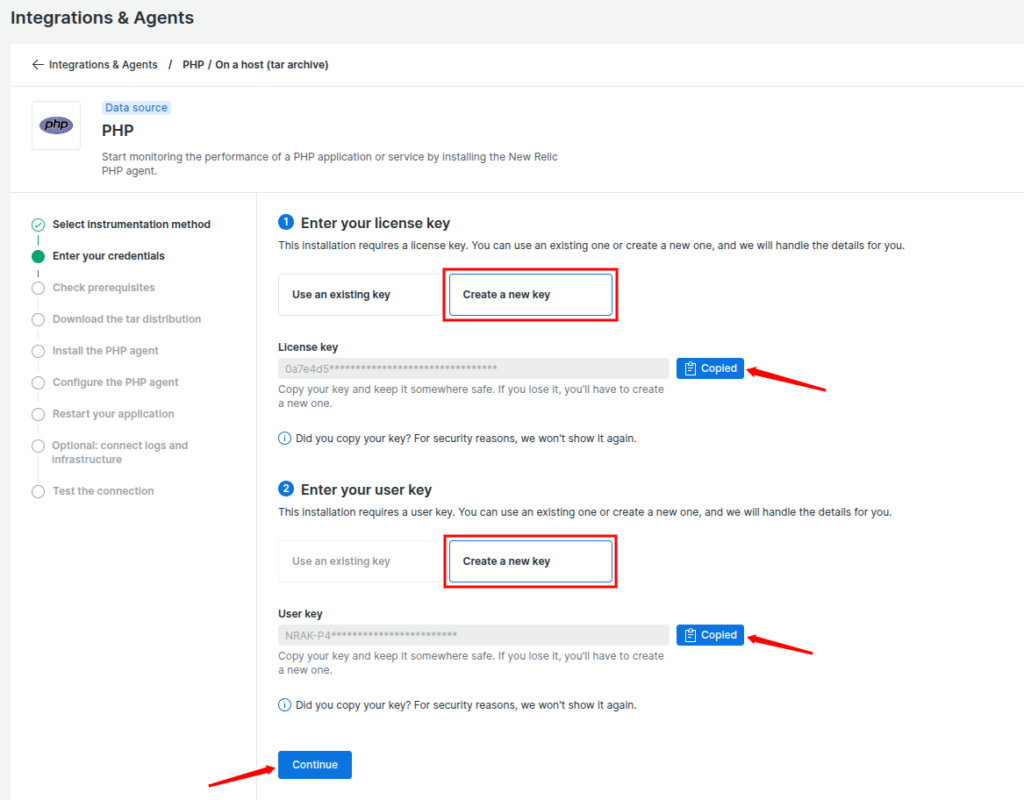
Step 3: Enter Credentials
- Here, you have to provide your user and license key. These keys will link your monitoring agent with your account.
- If you already have one, enter it in the given field by selecting Use an existing Key. Let’s create a new one if you don’t have it.
- Click on the Create a new key buttonin license key and user key section, and it will generate a key for you.
- Once it is generated, copy your license and user key. This license key is what connects your Linux server to your New Relic account. Keep it safe, as you’ll need it during configuration.
- Click on the Continue button.
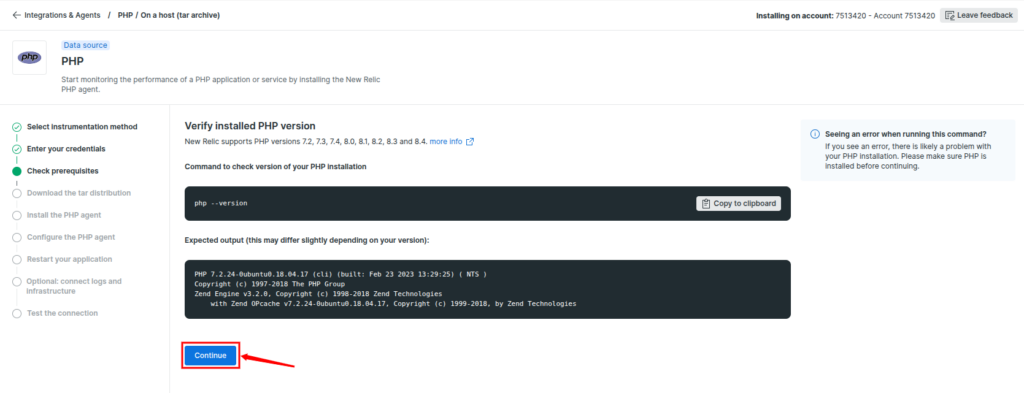
Step 4: Check Prerequisites
- Verify the installed PHP version on your server.
- You can directly run the given command to check your PHP version and compatibility.
php --version- After checking the PHP version, click on Continue.
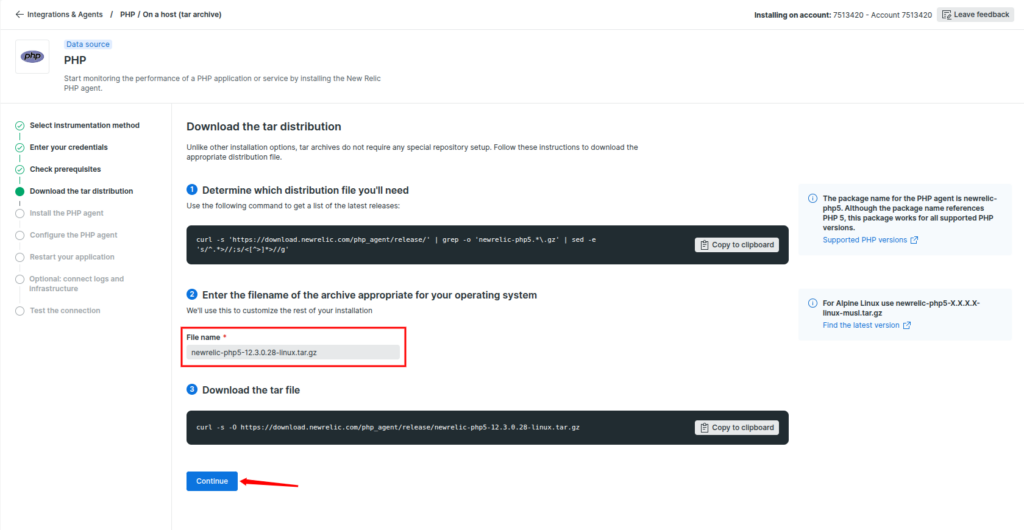
Step 5: Download the Tar Distribution
- Copy the given command and run it in your terminal.
- The file will be named something like newrelic-php5-X.X.X.X-linux.tar.gz.
- Enter the file’s name in the field below. It will automatically generate a command that you can run on your server to download the file.
- Once the script is generated, download the tar file by copying the given command and pasting it into the terminal.
Step 6: Install or update the PHP Agent
Once the download is complete, execute the given commands to;
- Decompress the downloaded tar archive.
- Change the directory to the newly created folder.

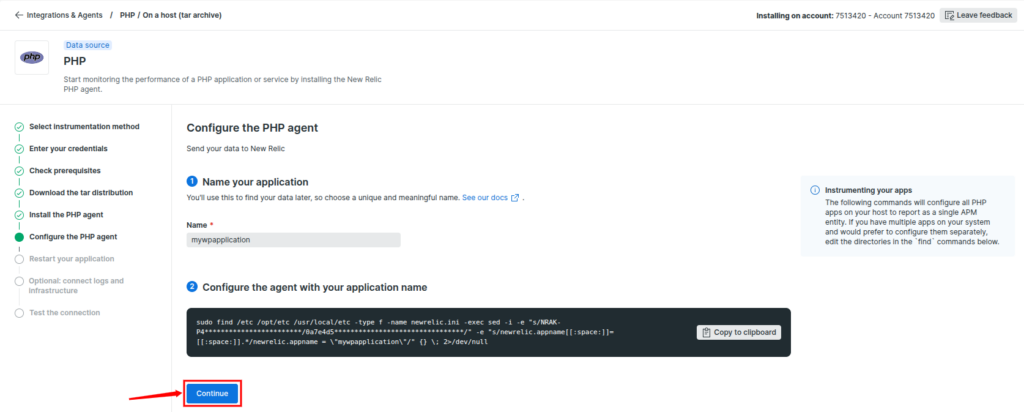
Step 7: Configure the PHP Agent
To connect your application with New Relic, you must configure the agent:
- Name your application: Enter the name of your web application. It will automatically find the correct php-fpm process.
- Configure the agent: Run the given script with your application name.
Click on the Continue button.

Step 8: Restart Your Application
You have to restart your web server services for the configuration changes to take effect.
- Restart your services: Use the appropriate command from given below for your server, for instance;
php-fpm: sudo service php-fpm restart
– Apache (Ubuntu/Debian): sudo service apache2 restart
– Apache (RHEL): sudo service httpd restart
– Nginx: sudo service nginx restart - Send data to New Relic: To initialize the agent and make sure it starts sending data, run the command below:
php -r ‘phpinfo(INFO_GENERAL);’ - Click on the Continue button.
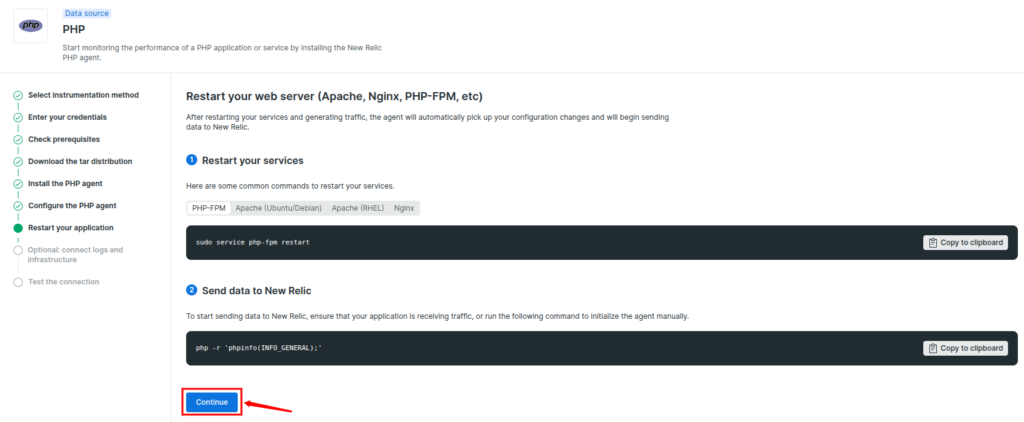
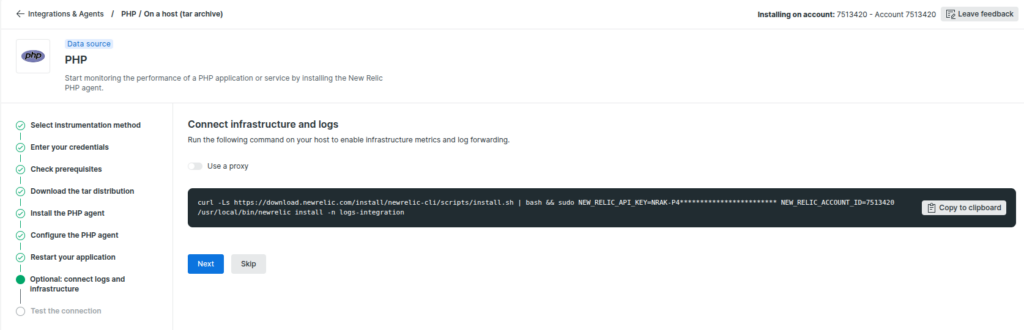
You can also connect the logs and infrastructure metrics to get a view of your server. Run the given command to install the required components. This is an optional step, you can skip it if you want.
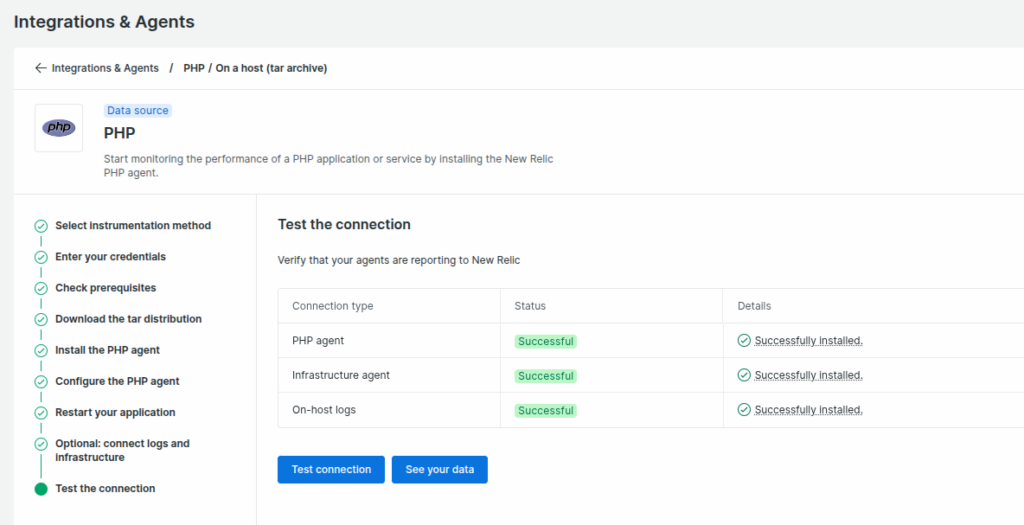
Step 9: Test the Connection
Just click on the Test connection button.
- After completing the steps for installation and configuration, let’s now test the connection to check that the agents are reporting correctly to New Relic or not.
- The status for the PHP agent will show a successful status, which indicates that the agent is installed correctly.
- Just click on the Test connection button.
New Relic Dashboard
It’s done! Your New Relic account is now ready to collect the data from your server and monitor your server. You can see your server metrics in the New Relic dashboard.
You can track your web application’s metrics in the “APM & Services” section. You can monitor error rates, logs, and set alerts to notify you of any failure. You can also monitor your website’s core web vitals using Browser monitoring.
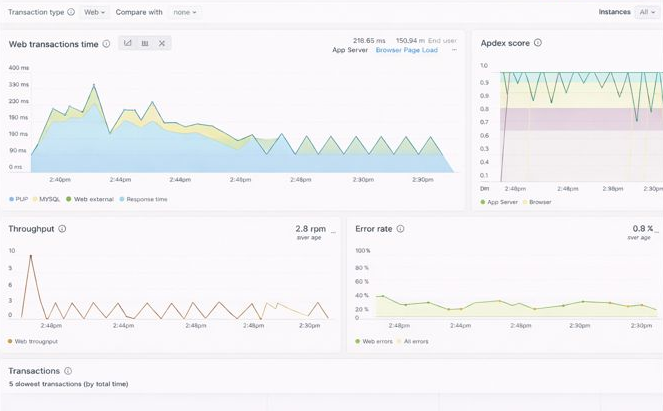
Using New Relic on your Linux server gives you clear visibility into how your infrastructure behaves under real-world workloads. Once installed, you can monitor critical system metrics such as CPU load, memory usage, disk activity, and network performance, helping you spot issues early and make informed optimization decisions.
Conclusion
Monitoring a Linux server is no longer optional if you want reliable performance and minimal downtime. With New Relic, you gain real-time visibility into how your server and applications behave under real workloads. From tracking CPU and memory usage to identifying slow transactions and application errors, New Relic helps you understand what’s happening on your server before issues turn into serious problems.
By following the steps outlined in this guide, you can install and configure New Relic on your Linux server with confidence. Once set up, the New Relic dashboard becomes a powerful tool for performance analysis, troubleshooting, and long-term optimization.
FAQs
1. How long does it take for data to appear in the New Relic dashboard?
In most cases, data starts appearing within a few minutes after installation and service restart. Sometimes it may take slightly longer during the initial setup
2. What is New Relic used for on a Linux server?
New Relic is used to monitor server performance and application behavior. It helps track CPU usage, memory consumption, disk activity, network traffic, errors, and response times in real time.
3. Which Linux distributions are supported by New Relic?
New Relic supports most popular Linux distributions, including Ubuntu, Debian, CentOS, Rocky Linux, AlmaLinux, and RHEL-based systems.
4. Can I monitor PHP applications with New Relic?
Yes, New Relic provides a PHP agent that allows you to monitor PHP applications, track response times, errors, slow transactions, and overall application performance.
5. Do I need to restart my web server after installing New Relic?
Yes, restarting services like PHP-FPM, Apache, or Nginx is required so that the New Relic agent can load properly and start sending data.
Stop Wasting Time on Servers. Start Building Instead.
You didn’t start your project to babysit servers. Let ServerAvatar handle deployment, monitoring, and backups — so you can focus on growth.
Deploy WordPress, Laravel, N8N, and more in minutes. No DevOps required. No command line. No stress.
Trusted by 10,000+ developers and growing.