
Running a Linux VPS can sometimes feel like managing the engine room of a ship. Everything looks smooth on the surface, but under the hood, the CPU, RAM, and disk are working hard to keep your websites and applications running. If you don’t keep an eye on these resources, your server can slow down, crash, or even stop responding when you least expect it.
That’s why learning, how to monitor CPU, RAM, and disk usage, on a Linux VPS is so important. The good news? It’s not as complicated as it sounds. Even if you’re not a tech person, with the right commands, and tools, you can easily track your server’s health, and resources.
In this guide, we’ll walk step by step through different methods to monitor these resources, from built-in Linux commands to the powerful and easy-to-use ServerAvatar platform. Whether you’re a beginner or an experienced system admin, this step-by-step guide will help you keep your VPS running smoothly.
Monitoring your system resources ensures:
- Performance: Identify performance issues before they lead to downtime.
- Stability: Prevent your server from crashing due to overload.
- Optimization: Use resources efficiently, saving money on upgrades.
- Security: Check for unusual spikes that could indicate malicious activity.
Understanding CPU, RAM, and Disk Usage Basics
Before diving into commands, let’s break down the three major resources:
- CPU (Central Processing Unit): It handles all processing tasks. The high CPU usage for long periods may slow down applications.
- RAM (Random Access Memory): It is temporary storage for active processes. If RAM runs out, the server will start using swap space that could slow down disk memory.
- Disk Usage: It refers to both space (how much storage is left), and performance (how fast the disk reads/writes).
How to Check CPU Usage on Linux VPS
Your CPU load shows how much work your server is doing. To see quick stats, you can use:
uptime
This command shows system load averages for the past 1, 5, and 15 minutes. A load higher than your CPU core count often indicates stress.

Monitor usage with the ServerAvatar
ServerAvatar is a managed cloud hosting provider, that makes it easy to deploy, manage, and monitor servers and applications without needing deep technical knowledge.
Unlike traditional control panels, it not only manages your servers and applications but also lets you directly create and host servers from supported cloud providers, like DigitalOcean and Vultr (Hetzner, and Linode are coming soon). So with ServerAvatar, you don’t need a separate cloud provider account, you can:
- Deploy and manage servers directly from ServerAvatar.
- Host and manage multiple applications (WordPress, Laravel, PHP based, Node.js based, etc.).
- Manage multiple servers and apps from a single dashboard.
- Get built-in monitoring, backups, SSL, firewall, fail2ban, and many more features to simplify your routine tasks
ServerAvatar provides both the servers and the management in one place, making hosting and management both simple, fast, easy, and hassle-free.
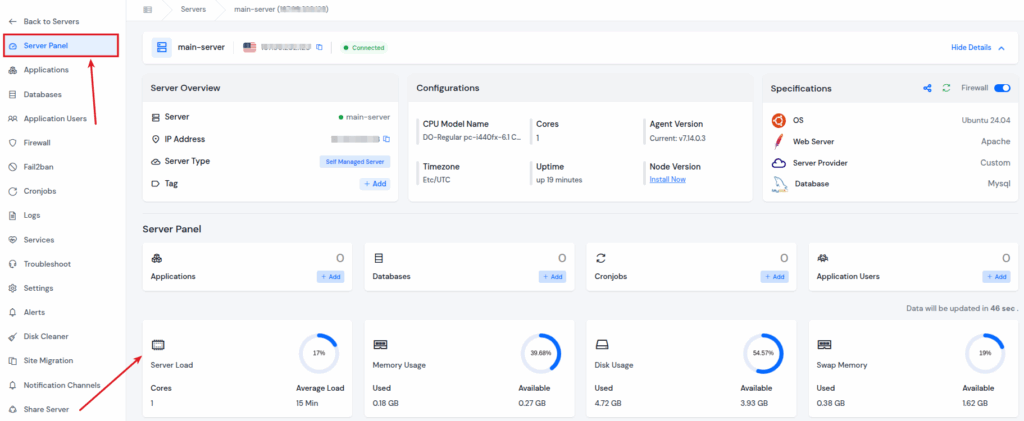
You can check out the live server resources usage easily with ServerAvatar, so you will get the information regarding available and used server disk, memory, and average server load directly from the server panel of the particular server.
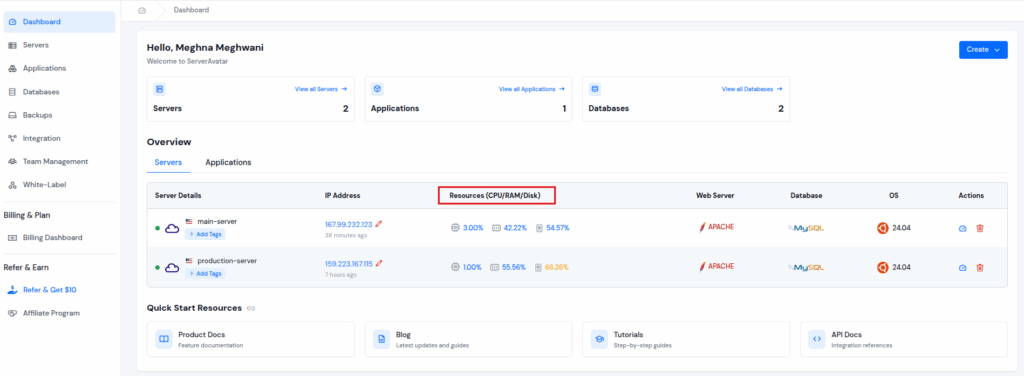
Additionally, you can see the server resources for all of your connected servers at once from the dashboard of ServerAvatar, as you can see in the image below.
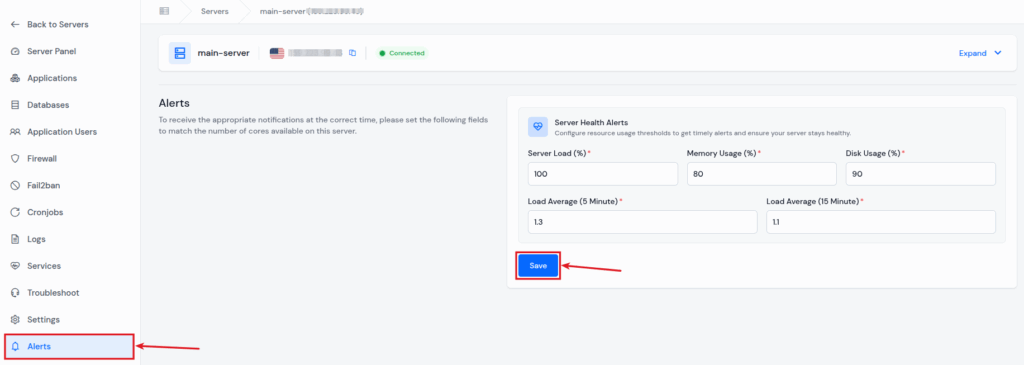
Additionally, ServerAvatar comes with a built-in server monitoring feature that allows you to easily keep track of CPU, RAM, and Disk usage directly from its dashboard. By navigating to the ServerAvatar’s Server Panel, you can see real-time and data, and historical data without relying on command-line or any third-party tools.
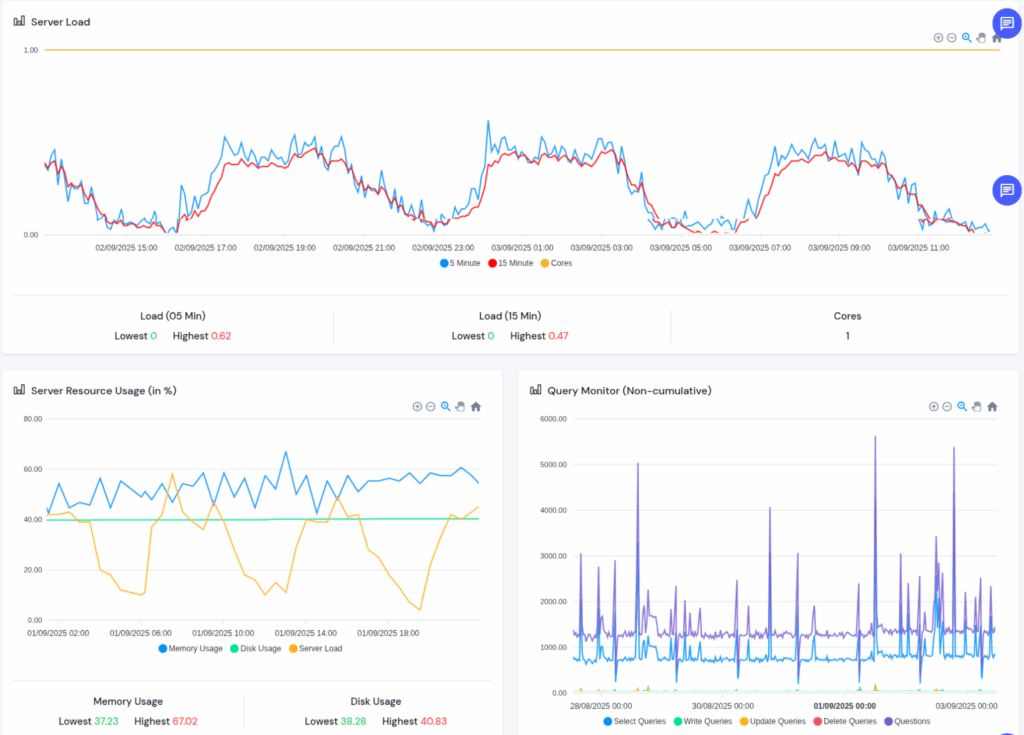
The dashboard presents, Server Load in the range of 5 and 15 minutes, memory usage, and disk usage through clean, visual graphs, making it simple to spot usage spikes, resources, or abnormal patterns.
You can also configure alerts to notify you when certain thresholds are reached, ensuring you stay ahead of potential performance issues.
Unlike traditional terminal-based monitoring methods, ServerAvatar displays data, helping you analyze server performance trends. For example, monitoring RAM utilization over time can help identify memory leaks in applications, while disk usage tracking ensures you don’t run into storage-related downtime.
This ServerAvatar feature reduces the need for manual checks with commands like, top, htop, or df -h, giving you a more user-friendly and proactive approach to server management.

How ServerAvatar Simplifies Monitoring
While Linux commands are powerful, not everyone wants to type them daily. That’s where ServerAvatar makes a big difference.
With ServerAvatar, you will get:
- Built-in Monitoring Dashboards: Easily check out server resource usage within a simplified dashboard.
- Historical Data: Track server resources data over time instead of only real-time values.
- Log Monitoring: Identify issues faster with centralized server and application log access.
- Automated Alerts: Stay informed without constantly logging in with Server Health Alerts.
This means you don’t just monitor your VPS, you understand it.
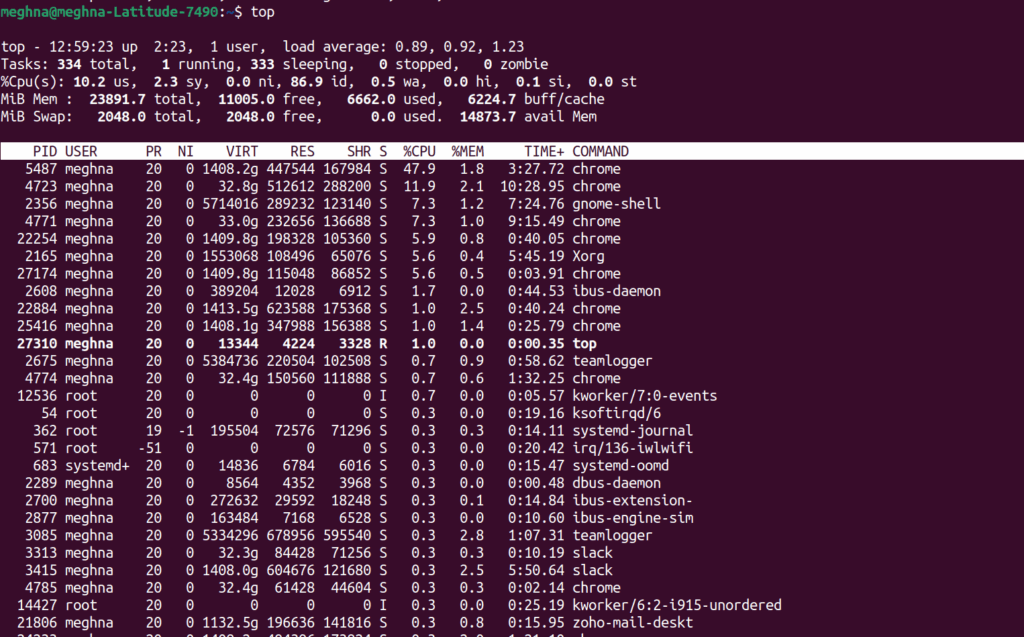
Using “top” Command for Real-Time Monitoring
The top command is like Task Manager in Windows. Just run the below given command:
topIt shows:
- CPU usage by each process.
- RAM consumption.
- Process IDs and uptime.
Press q to quit and k to kill a process.
Checking Memory with “free -m” Command
Just like a desk gets cluttered when you use more books, your server slows when RAM fills up.
Run below given command:
free -mThis shows memory in MB. Just look for:
- Used memory: How much RAM is actively used.
- Free memory: Available RAM.
- Available: Memory that can still be used without swapping.

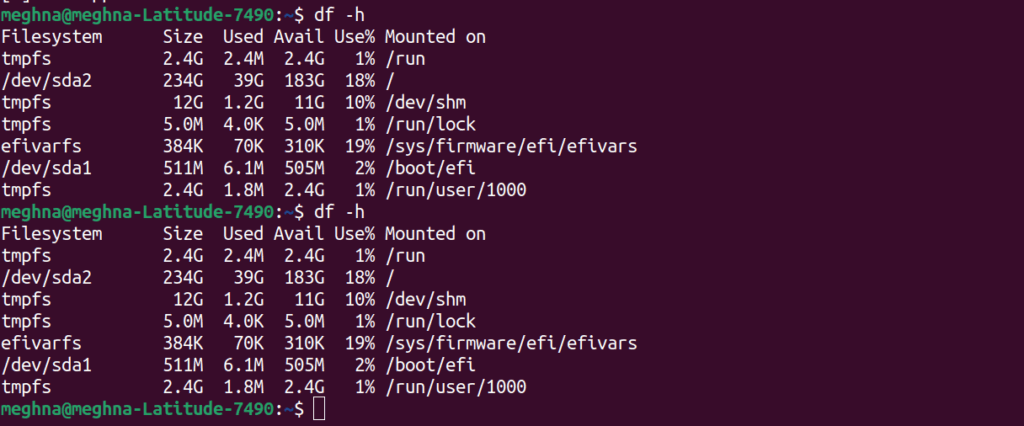
How to Check Disk Usage on Linux VPS
If your disk fills up, your server can stop functioning, and sometimes even logging in may fail.
Using df -h to See Disk Space
Run:
df -hThis shows disk partitions, usage percentage, and free space in human-readable format (GB/MB).
Conclusion
Monitoring CPU, RAM, and disk usage on your Linux VPS isn’t just a technical grind, it’s the key, to keeping your server fast, stable, and secure. While Linux commands like top, free, and df -h give you quick insights, relying on them alone can become repetitive and time-consuming. That’s where tools like, ServerAvatar step in, making the process effortless, with visual dashboards, data, and automated alerts.
By keeping a close watch on these resources, you can prevent unexpected downtime, catch performance blockages early, and optimize your server for long-term growth. Whether you’re managing a single website, or running multiple applications, regular monitoring ensures that your VPS works with you, not against you.
FAQs
1. How can I check CPU usage on a Linux VPS?
You can use commands like top, htop, or uptime for real-time CPU stats.
2. What’s the easiest way to monitor RAM usage?
Run free -m for a quick snapshot, or use ServerAvatar’s dashboard for a visual view.
3. How do I check disk space and performance?
Use df -h for space and iostat for performance analysis.
4. Do I need third-party tools if I use ServerAvatar?
Not necessarily, ServerAvatar already provides all the monitoring data with graphs on your ServerAvatar dashboard.
5. Can I set alerts for high resource usage?
Yes, with ServerAvatar, you can set the alert when usage reaches critical levels.