

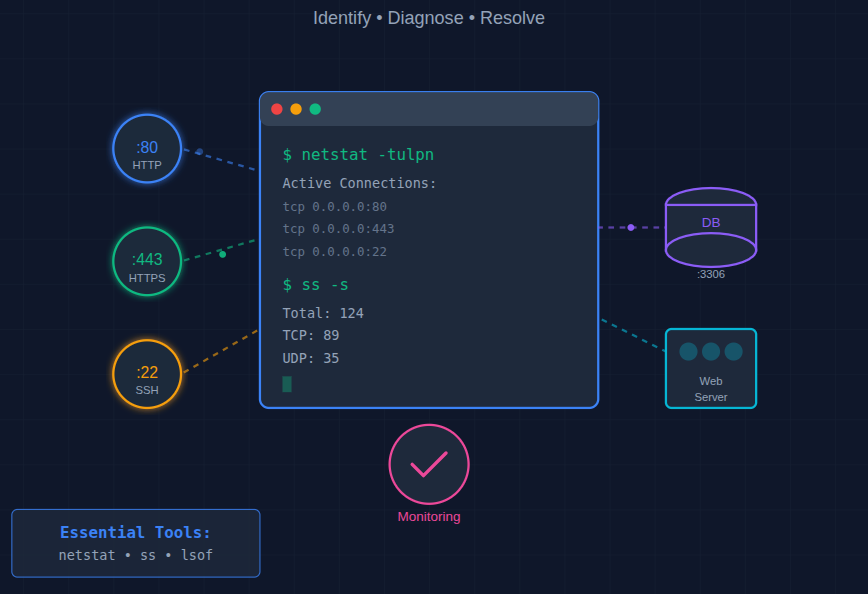
When dealing with network issues on a Linux server, netstat, ss, and lsof are essential tools that help you understand what’s happening beneath the surface. When your server starts behaving strangely, like slow connections, strange ports being open, or unresponsive applications, it often points to a network-related issue. In Linux, tools like netstat, ss, and lsof can help you quickly diagnose and fix these problems. They reveal what’s really going on under the hood of your system.
Have you ever wondered how to find out what’s happening behind the scenes of your network connections, which applications are using your ports, or why your server feels slower than usual? The netstat, ss, and lsof trio is widely used for analyzing open ports, socket connections, and running processes in Linux servers.
Whether you’re a system administrator, developer, or just a curious learner, mastering these commands can save you hours of troubleshooting. In this guide, we’ll break them down in simple language.
What Is Network Debugging?
Network debugging is the process of identifying, diagnosing, and resolving issues that affect connectivity, performance, or communication between systems and services. This includes checking open ports, monitoring active connections, finding which process is using a particular port, and detecting suspicious activity.
Every application that communicates over a network, like a web server, database, or SSH session, uses network ports and sockets. Understanding these helps you find bottlenecks, unwanted connections, and possible intrusions.
For Linux users, command-line tools like netstat, ss, and lsof are essential for performing these tasks efficiently.
Why Network Debugging Matters
Imagine your server as a busy platform. Each connection uses a port. If too many ports are used at once, or if any required port is blocked, chaos follows. Network debugging ensures smooth traffic flow by showing you which applications are using which “ports”.
For system administrators and developers, regular network inspection is crucial for:
- Detecting unauthorized access.
- Resolving “port already in use” errors.
- Optimizing server performance.
- Ensuring application connectivity.
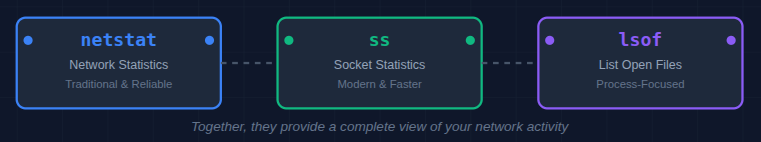
Overview of netstat, ss, and lsof
These three tools form the backbone of Linux network diagnostics:
- netstat (network statistics): A traditional tool that shows active connections, routing tables, and network interface stats.
- ss (socket statistics): A modern, faster alternative to netstat with more detailed socket information.
- lsof (list open files): Lists all open files and the processes using them, including network sockets.
While each has its own strengths, using them together gives a complete picture of your system’s network activity.
Using netstat, ss, and lsof for Network Debugging
Using netstat for Quick Network Overview
The netstat (network statistics) is one of the oldest and most commonly used tools for viewing network connections, routing tables, and interface statistics. Although it’s being gradually replaced by ss, it’s still widely available and useful. It can show:
- Active TCP and UDP connections.
- Listening ports.
- Routing information.
- Network interface statistics.
Basic Syntax:
netstat [options]Basic netstat Commands:
1. Show all active connections
netstat -ant- -a: Show all connections and listening ports
- -n: Show numeric addresses instead of hostnames
- -t: Show TCP connections
This gives you a list of all active TCP connections, along with local and remote addresses.
2. Display listening ports only
netstat -tuln- -u: Include UDP ports
This is useful for checking which services are currently waiting for connections.
3. Show process using a port
netstat -tulpn- -p: Show the process name and PID
Perfect for identifying which process is occupying a specific port.
netstat -tulnThis command lists all TCP and UDP ports currently listening for incoming connections.
4. Show all listening ports:
netstat -l5. Display numeric addresses (no DNS resolution):
netstat -n6. Show network interface statistics:
netstat -iTip: Combine -t (TCP), -u (UDP), -l (listening), and -p (process) for the most insightful view.
Using ss for Faster Network Analysis
The ss (socket statistics) is a modern replacement for netstat. It’s faster, more precise, provides more detailed information, and is now included in most Linux distributions by default.
Basic Syntax:
ss [options]Common ss Commands
1. Show all TCP connections
ss -t -a2. Show listening sockets only
ss -ltn3. List all listening TCP sockets:
ss -lt4. Display process details
ss -ltnp5. Show all listening UDP sockets:
ss -lu6. Display all connections with processes:
ss -p7. Find connections from a specific IP:
ss dst [ip address]8. Filter by state
For example, to show only established connections:
ss state establishedThese filters make ss especially useful for isolating problematic connections during debugging.
Why choose ss over netstat?
- It’s faster and more lightweight.
- Provides advanced filtering options.
- It provides more socket-level details.
- Actively maintained in modern Linux systems.
Using lsof to Track Open Files and Sockets
lsof stands for “List Open Files“. In Linux, almost every component, even network sockets, is handled as a file. This makes lsof extremely useful for tracking which files or network connections a process has opened. It displays open ports, processes, and file locks, giving you a deeper look into what’s going on.
Basic Syntax:
lsof [options]1. List all open network connections
lsof -i2. Find which process is using a specific port
For example, to check which process is using port number 80:
lsof -i :80This instantly tells you which service is running on port 80.
3. Show connections for a specific protocol
lsof -iTCP -sTCP:LISTENThis lists all TCP ports currently in the LISTEN state.
4. Find open files by a specific process
lsof -p <PID>Replace <PID> with the process ID to see all files that process has opened.
5. Display all processes for a specific user:
lsof -u username6. Kill a process using a particular port:
kill -9 $(lsof -t -i :8080)When a port is mysteriously “in use,” lsof helps you find the culprit quickly.

netstat, ss, and lsof – When to Use Each Tool
| Tool | Best For | Advantages |
| netstat | Quick, general network overview | Simple and widely available |
| ss | Detailed socket analysis | Fast and powerful filtering |
| lsof | File and process-level insight | Works beyond just networking |
Rule of Thumb for netstat, ss, and lsof:
Use netstat for a quick check, ss for in-depth socket debugging, and lsof when you need to trace processes or open files.
Real-World Scenarios: Debugging Network Issues
In real-world debugging situations, running netstat, ss, and lsof commands often reveals hidden issues that are otherwise difficult to trace.
Let’s say your web server suddenly becomes unresponsive. Here’s how you might approach it:
- Check listening ports:
ss -ltAre your web server and database ports open?
- Identify processes using key ports:
lsof -i :80Is the right process running?
- Look for suspicious connections:
ss state establishedUnexpected connections may indicate security issues.
- Check network traffic volume:
netstat -s- Stop the conflicting service
sudo kill <PID>- Restart your web server
For example, restarting the Nginx webserver:
sudo systemctl restart nginxThis gives protocol-level statistics to detect packet loss or congestion.
Common Mistakes to Avoid
Even seasoned admins slip up sometimes. Avoid these pitfalls:
- Ignoring UDP connections (many services rely on them).
- Confusing listening vs established states.
- Forgetting to close or restart processes after killing ports.
- Running old netstat versions with outdated flags.
- Overlooking automation, manual debugging takes time.
FAQs
1. What is the difference between netstat, ss, and lsof?
netstat shows general network statistics, ss provides faster and more detailed socket information, and lsof lists open files and the processes using them. Together, the netstat, ss, and lsof tools give a complete view of network activity.
2. How can I check which process is using a port in Linux?
You can use: ‘lsof -i :PORT_NUMBER‘ to find the exact process and PID.
3. Is ss always better than netstat?
In most cases, ss is faster, more accurate, and offers advanced filtering. However, netstat is still useful for quick, simple checks.
4. Can netstat ss lsof help identify suspicious connections?
Absolutely. Running netstat, ss, and lsof commands helps you see active connections, unknown open ports, and unusual traffic patterns that may indicate intrusion.
5. Do all Linux distributions support netstat, ss, and lsof?
ss and lsof are available in almost all modern Linux distributions. netstat may need installation on newer systems, but the package is still widely available.
Conclusion
Debugging network issues becomes much easier when you understand how to use netstat, ss, and lsof. Each tool offers unique insights into your server’s connections, ports, and active processes. When combined, they give you a powerful and complete picture of what’s happening on your Linux system.
By mastering these commands, you can quickly detect bottlenecks, find unauthorized access, resolve “port already in use” errors, and keep your server running smoothly. Whether you’re a beginner or an experienced administrator, regularly using netstat, ss, and lsof helps you maintain better control over your network and respond to issues before they become serious problems.
Stop Wasting Time on Servers. Start Building Instead.
You didn’t start your project to babysit servers. Let ServerAvatar handle deployment, monitoring, and backups — so you can focus on growth.
Deploy WordPress, Laravel, N8N, and more in minutes. No DevOps required. No command line. No stress.
Trusted by 10,000+ developers and growing.