Error
The Error Monitoring Dashboard provides a detailed breakdown of server errors, their sources, and trends to help you diagnose and resolve issues efficiently.
Error Overview
This section highlights key application error metrics, including the total number of errors recorded, the most frequently occurring error code, and the top country responsible for errors. The Total Errors metric indicates the number of failed requests, with the Most Common Error showing the HTTP status code responsible for the majority of failures. Additionally, the Top Error Source pinpoints the country from which the highest number of errors originated, helping teams identify potential access or configuration issues.

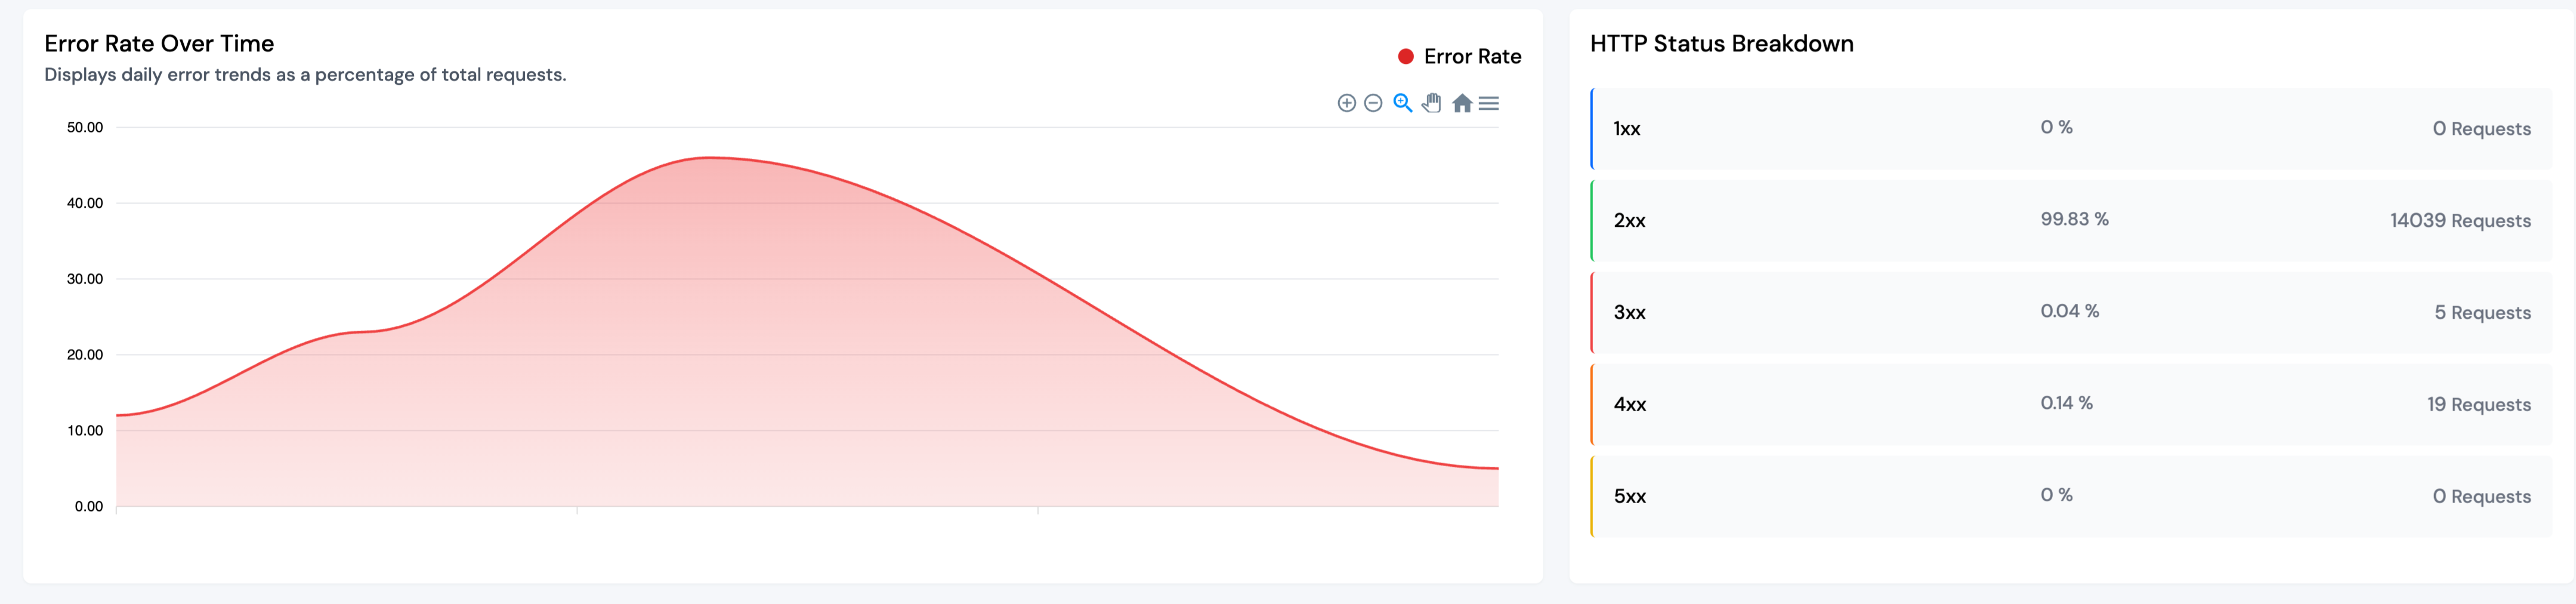
Error Rate Over Time
A graphical representation of the error rate over a given period helps track daily trends in failed requests. This visualization allows administrators to identify abnormal spikes in errors, correlate them with deployments or external factors, and take corrective actions to maintain application stability.
HTTP Status Breakdown
The HTTP status breakdown categorizes all responses received by the application into 1xx (Informational), 2xx (Successful), 3xx (Redirection), 4xx (Client Errors), and 5xx (Server Errors). A high percentage of 4xx or 5xx errors may indicate broken links, incorrect API requests, unauthorized access attempts, or server misconfigurations.
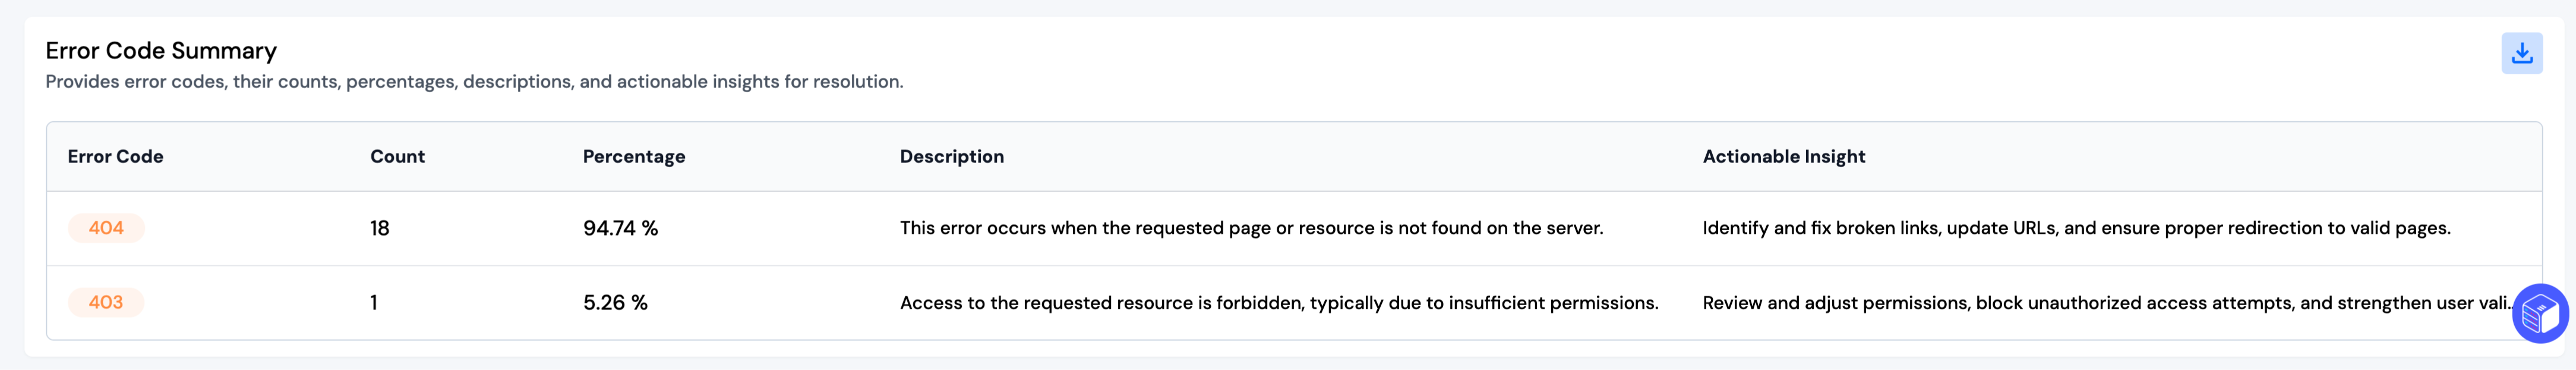
Error Code Summary
This section lists all error codes encountered, along with their frequency, percentage of total errors, descriptions, and actionable insights. For example, a 404 error occurs when a requested page or resource is missing, often due to broken links or incorrect URLs. The provided insight suggests identifying broken links and ensuring proper URL redirection. A 403 error, indicating access restrictions, suggests reviewing user permissions and strengthening authentication mechanisms.
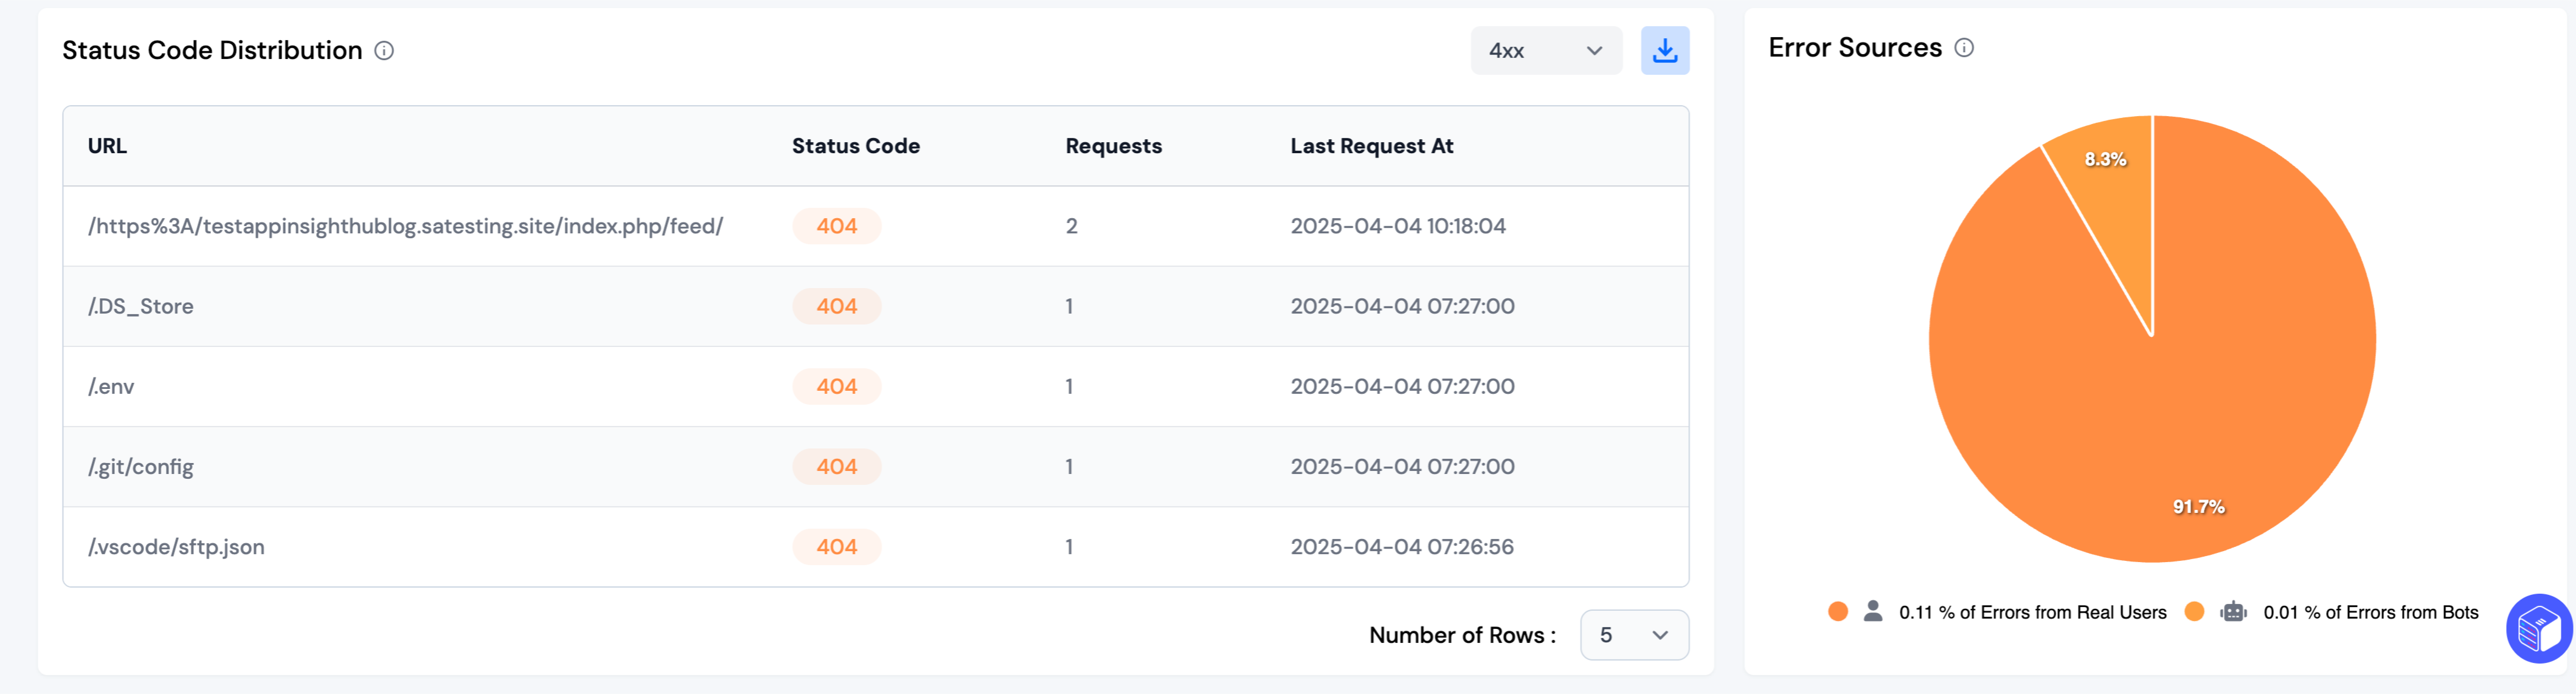
Status Code Distribution
The Status Code Distribution section logs all URLs that returned an error response, displaying the associated status codes, request counts, and the most recent timestamp of occurrence. This enables administrators to pinpoint specific endpoints that need attention and investigate why particular URLs are failing.
Error Sources
A pie chart representation of error sources categorizes errors based on their origin, differentiating between real users and bot traffic. A high percentage of bot-generated errors may indicate malicious activity, while user-generated errors could signal UX or navigation issues.
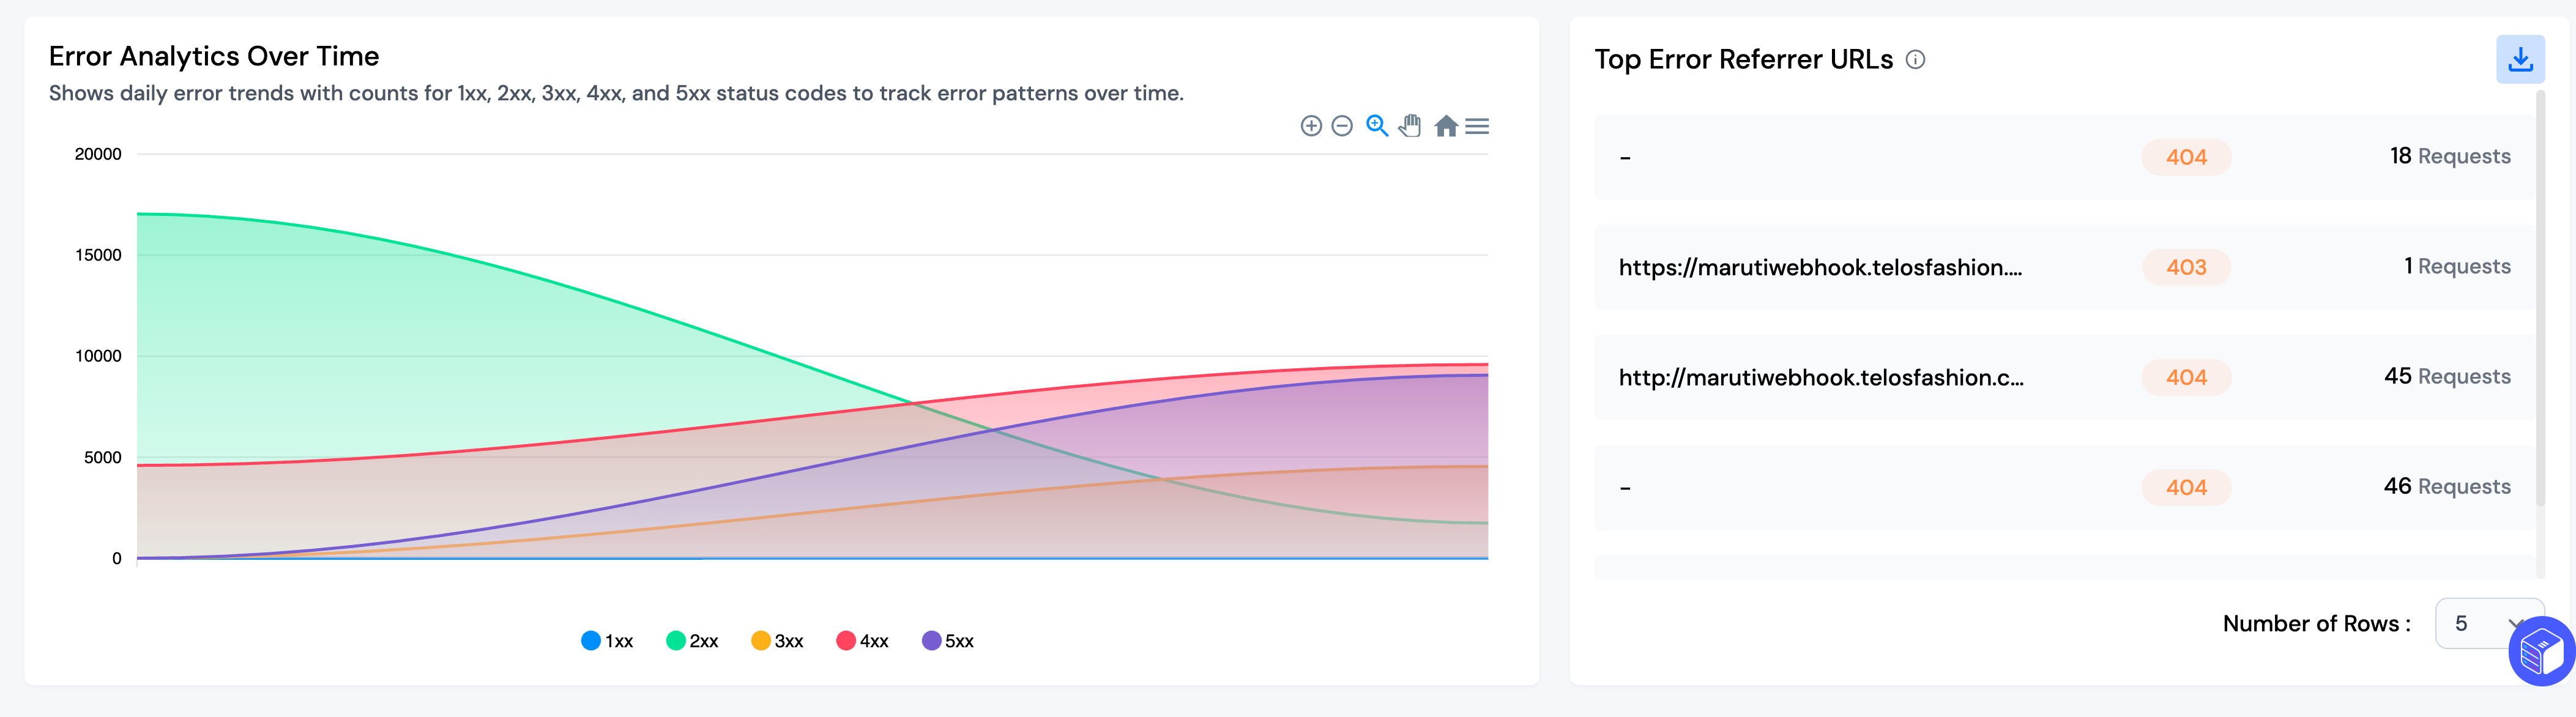
Error Analytics Over Time
A time-series chart displays error trends for different status code categories, helping administrators recognize recurring patterns or anomalies. This information is crucial for identifying system stability issues and assessing whether recent fixes have successfully reduced error occurrences.
Top Error Referrer URLs
This section lists the URLs that generated the most errors, helping administrators trace problematic referral sources. If a significant number of 404 or 403 errors originate from specific pages or external domains, this suggests a need for URL corrections, redirections, or improved access management.
The Error Monitoring Dashboard equips developers and system administrators with essential insights into error trends, helping them proactively detect and resolve issues to ensure a seamless user experience. Continuous monitoring and timely intervention prevent major outages and enhance the overall reliability of the application.
Note: You can download the full data of the table as a CSV file using the download button. By default, five rows are shown, but you can increase the count using the dropdown menu.