User Agent
The User Agent Monitoring Dashboard provides insights into the devices, browsers, and operating systems accessing the application. This data helps administrators track visitor technology trends and identify suspicious or unexpected activity.
User Agent Overview
This section highlights key user agent statistics, including:
-
Most Active User Agent: Identifies the most frequently used user agent.
-
Total Requests by User Agent: The total number of requests associated with different user agents.
-
Total Unique User Agents: The number of distinct user agents that have accessed the application.

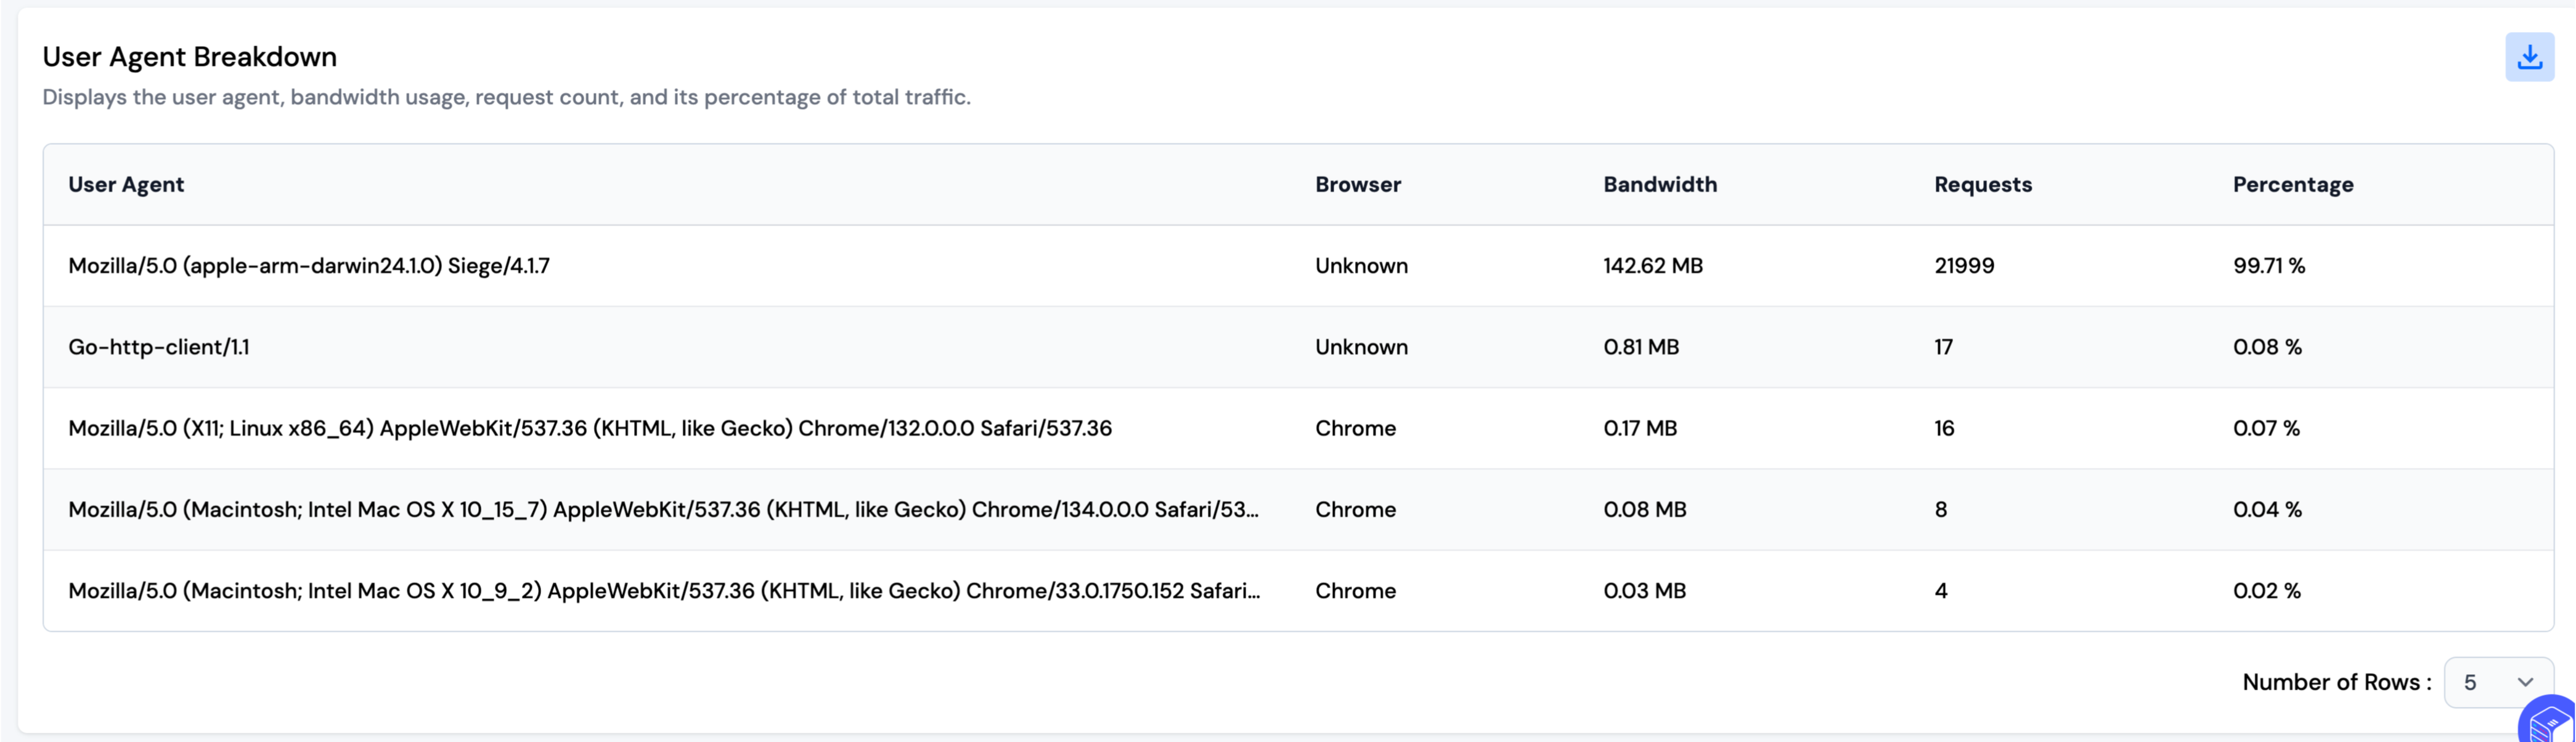
User Agent Breakdown
This section provides detailed insights into user agent activity, displaying:
-
User Agent String: Identifies the browser, device, and OS used in the request.
-
Browser Type: Specifies the browser associated with the user agent.
-
Bandwidth Usage: Indicates the data consumption per user agent.
-
Request Count: The total number of requests made by each user agent.
-
Percentage of Total Traffic: The proportion of total requests attributed to each user agent.
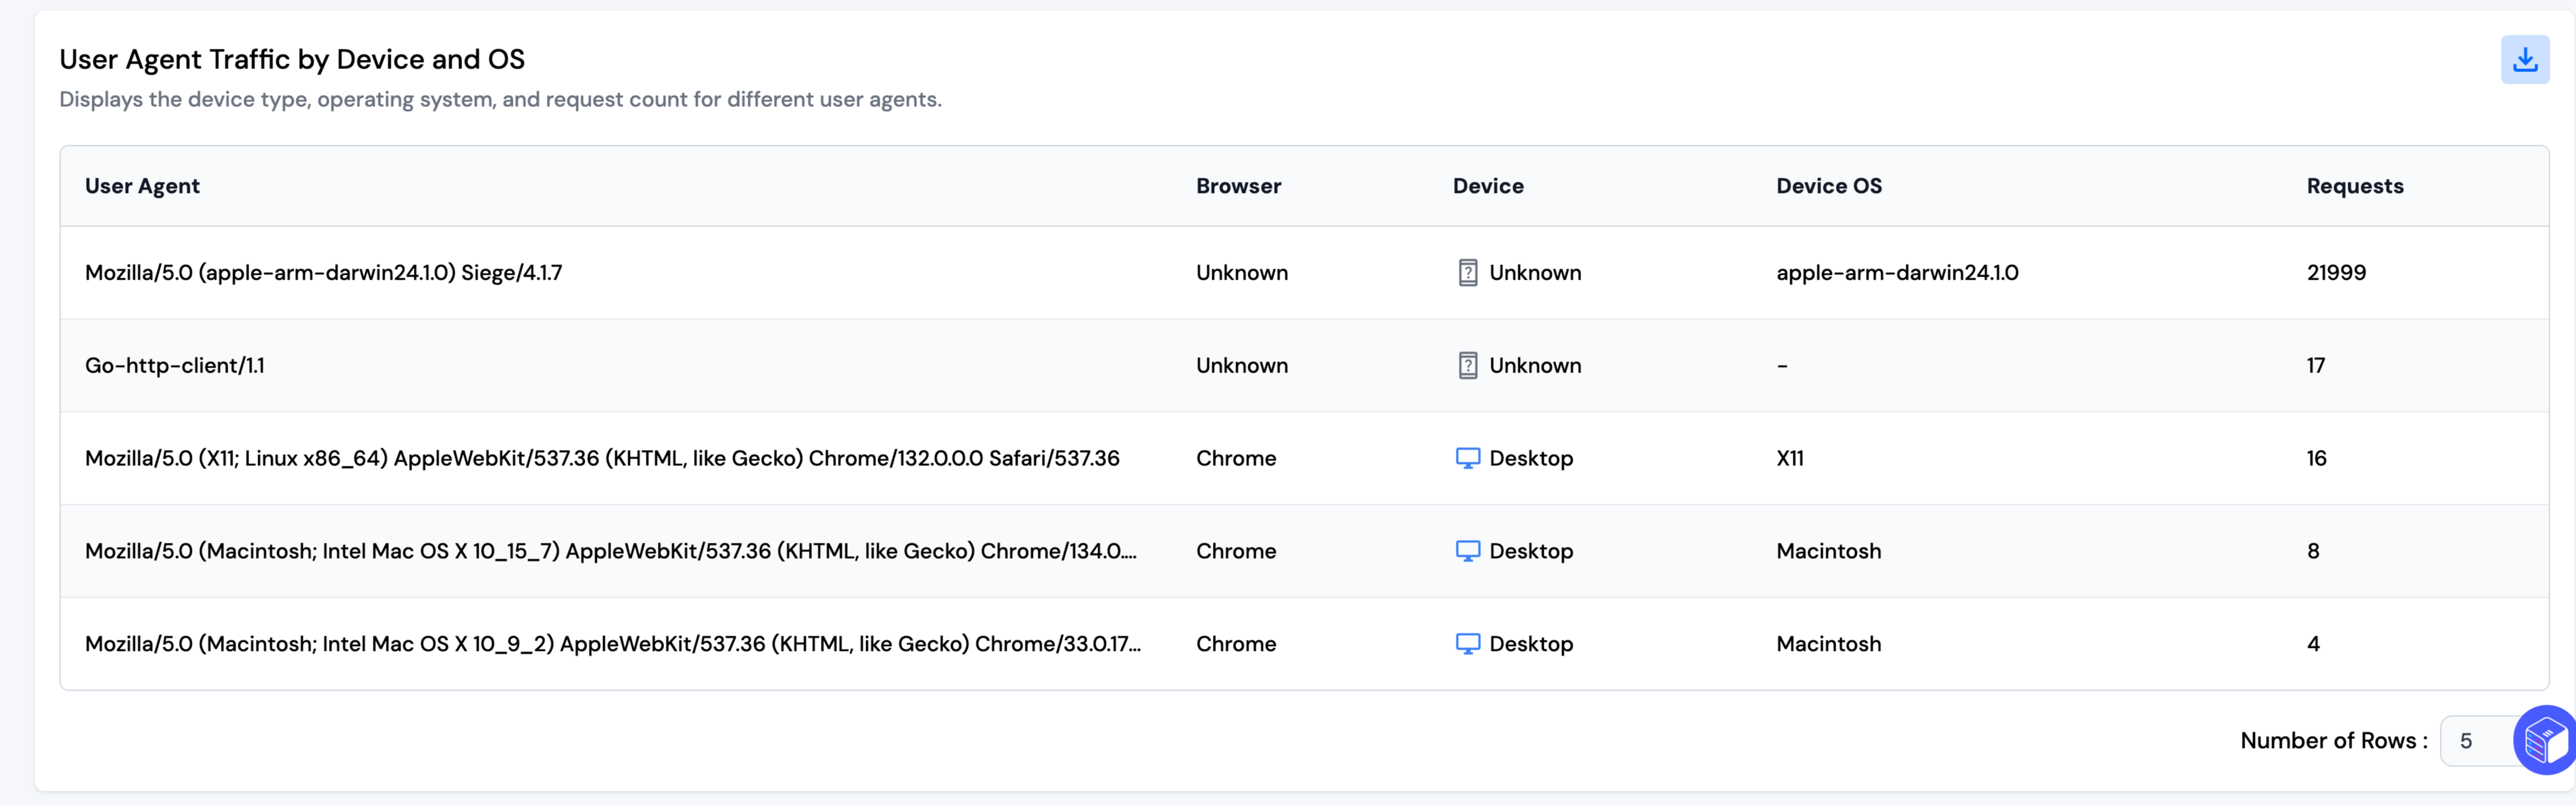
User Agent Traffic by Device and OS
This section categorizes traffic by device type and operating system, displaying:
-
User Agent: The detailed user agent used for requests.
-
Browser: The browser associated with the user agent.
-
Device Type: Specifies whether the request originated from a desktop, mobile, or other device.
-
Operating System: Identifies the OS used by the device (e.g., Windows, macOS, Linux).
-
Request Count: The total number of requests per user agent.
This breakdown helps in detecting unusual access patterns, such as outdated browsers or suspicious automated scripts.
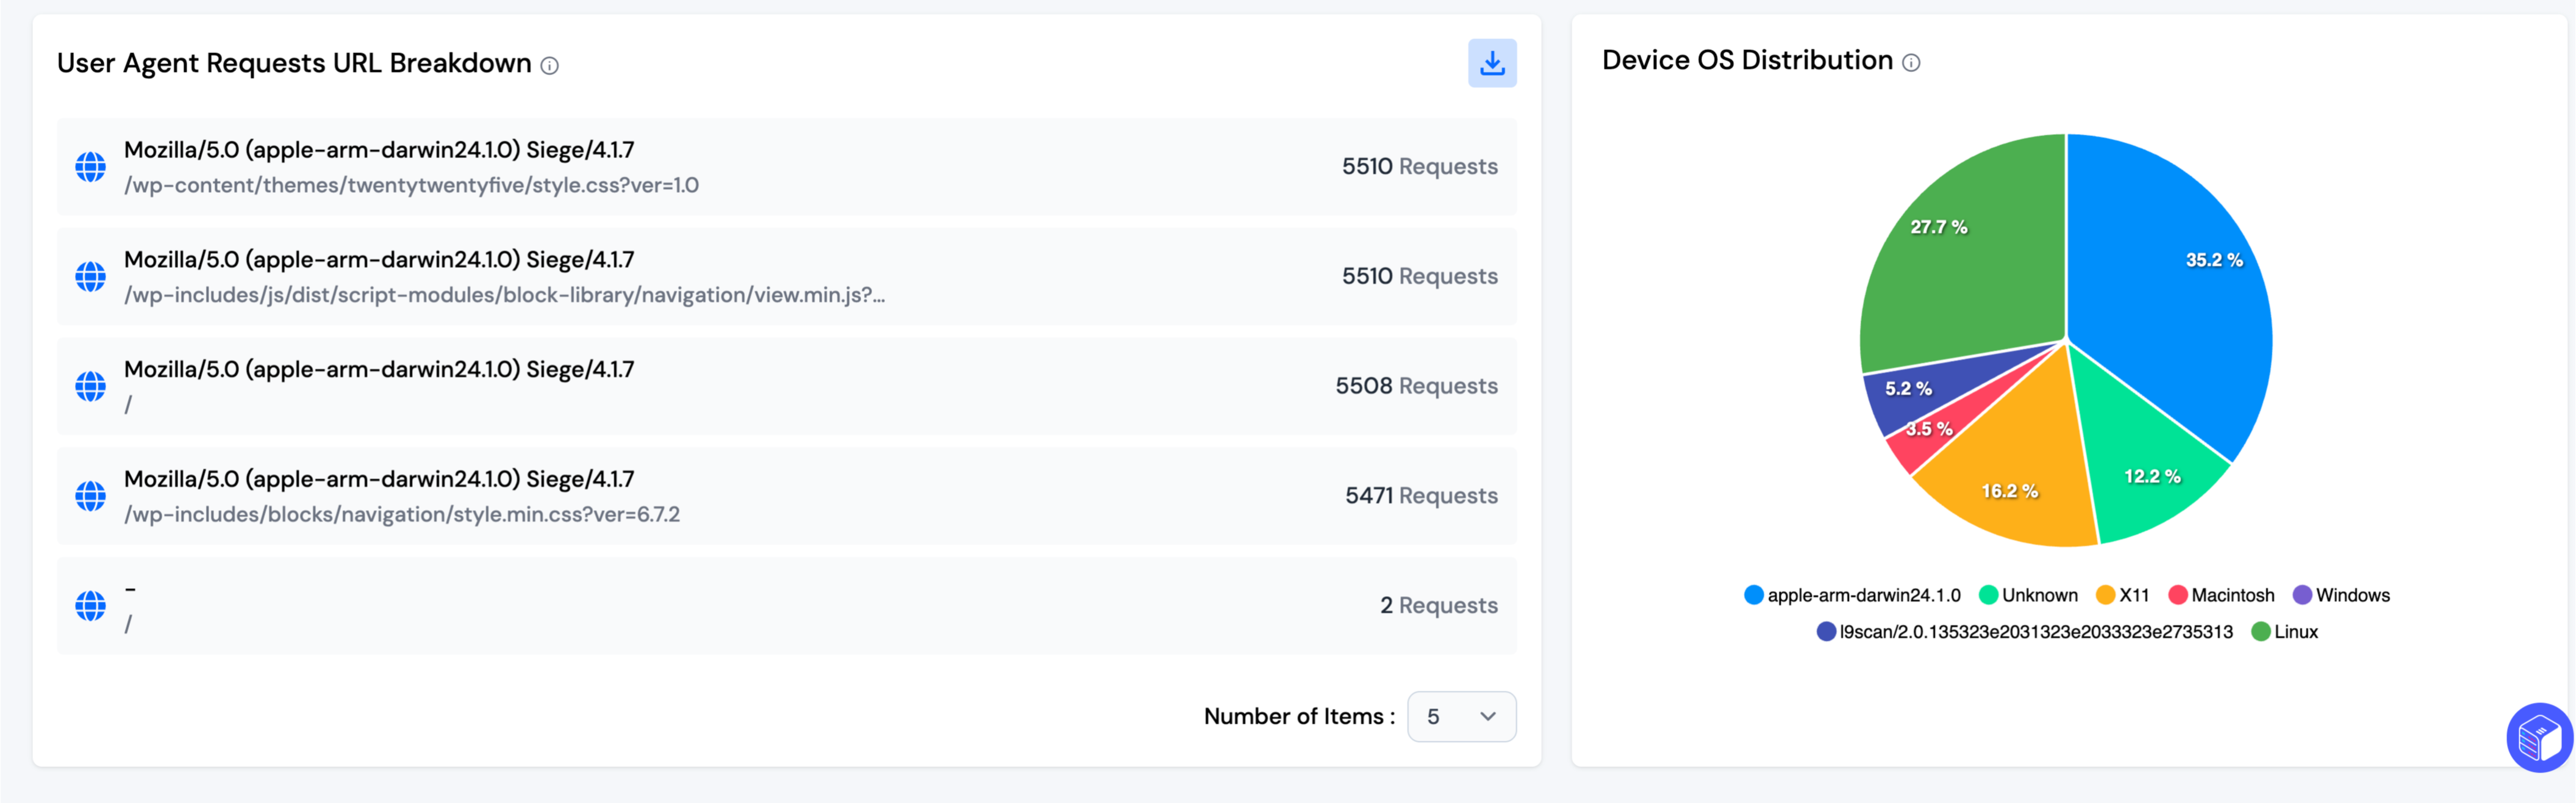
User Agent Requests URL Breakdown
This section lists the most frequently requested URLs by each user agent, providing insights into:
-
User Agent String: The specific user agent making the requests.
-
Requested URLs: The web pages or assets accessed.
-
Request Count: The number of times each URL was accessed by the given user agent.
Tracking URL requests per user agent helps detect potential web scraping, bot activity, or security vulnerabilities.
Device OS Distribution
A pie chart visualization displays the proportion of different operating systems accessing the application. This helps in identifying the dominant OS among users and detecting anomalies in access patterns.
Note: You can download the full data of the table as a CSV file using the download button. By default, five rows are shown, but you can increase the count using the dropdown menu.