Traffic
The Traffic Monitoring Dashboard provides a comprehensive breakdown of user traffic patterns, system requests, and visitor analytics, helping developers and administrators optimize application performance and security.
Traffic Overview
The traffic overview section displays key application metrics, including the total number of requests received, unique visitors, SSL status, success rate, error rate, and the proportion of human versus bot traffic.
The Total Requests metric represents the overall number of HTTP requests received by the application, while Unique Visitors highlights the number of distinct users accessing the site. If SSL is installed, it ensures secure communication for users. The Success Rate indicates the percentage of successful responses, whereas the Error Rate shows the proportion of failed requests.
Additionally, the dashboard differentiates between Human Traffic and Bot Traffic, allowing users to monitor suspicious or automated access patterns.

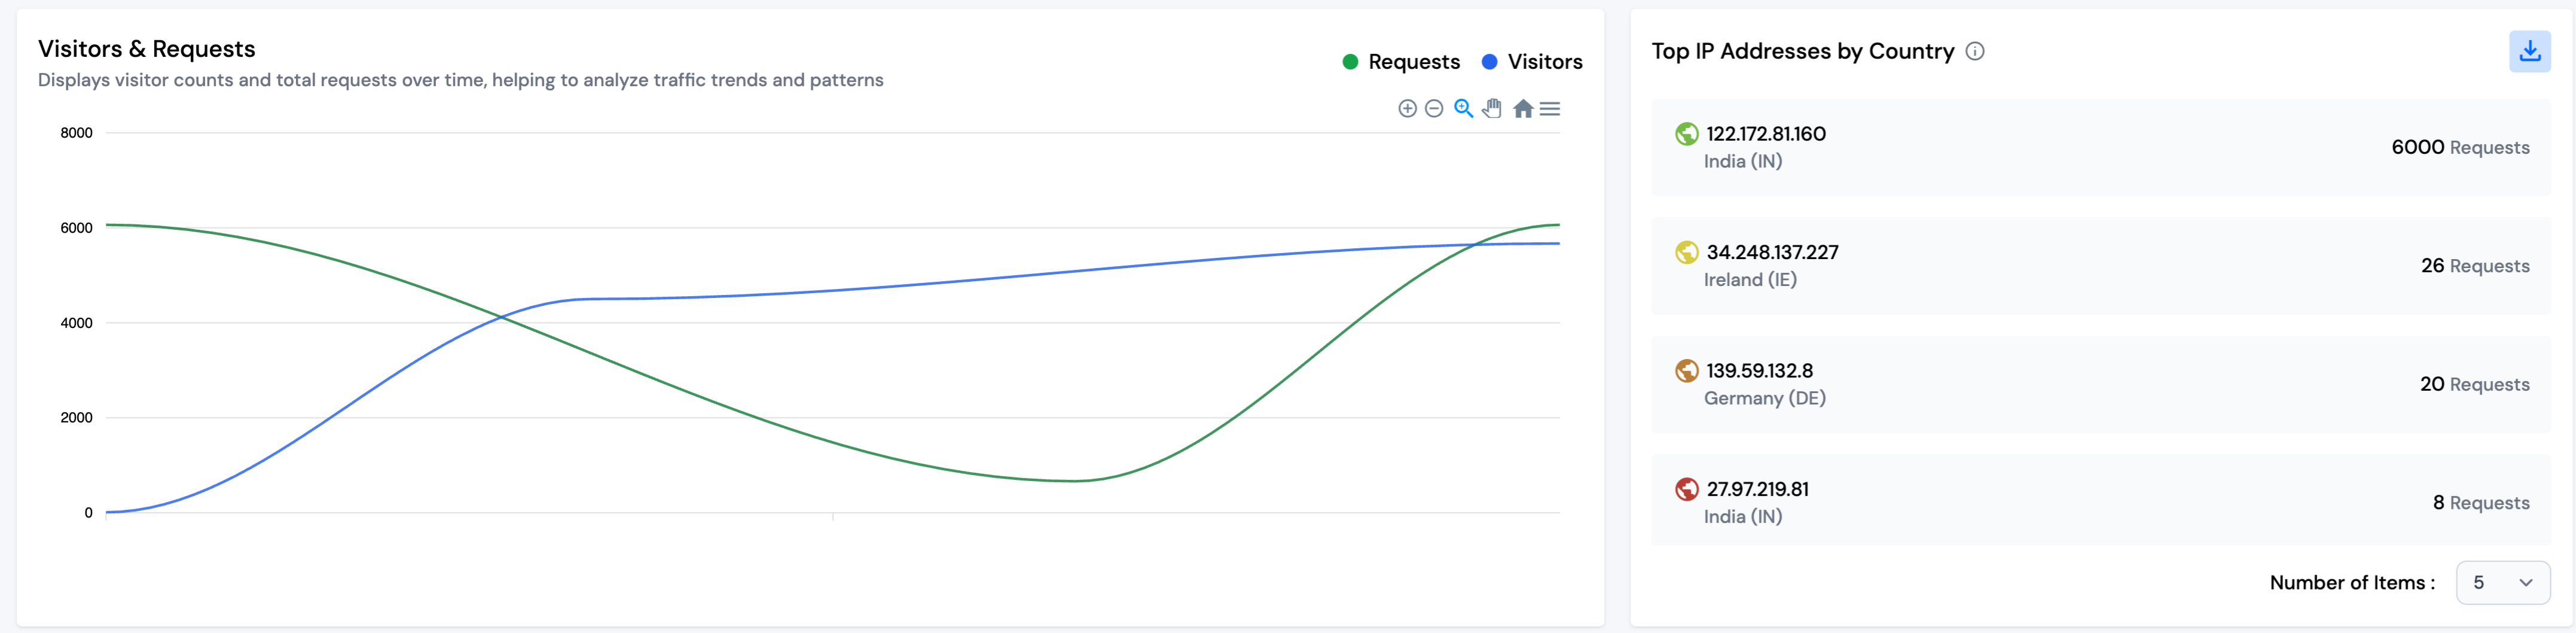
Visitors & Requests
A graphical representation of visitor traffic and total requests over time helps administrators analyze trends. This visual data helps identify sudden traffic spikes, seasonal patterns, and unusual fluctuations that may indicate security threats or downtime. The graph enables a proactive approach to performance monitoring by ensuring a smooth user experience.
Top IP Addresses by Country
This section displays the most active IP addresses accessing the application, along with their respective countries and request volumes. If a particular IP or region generates an unusually high number of requests, administrators can investigate potential threats or optimize content delivery for high-traffic locations.
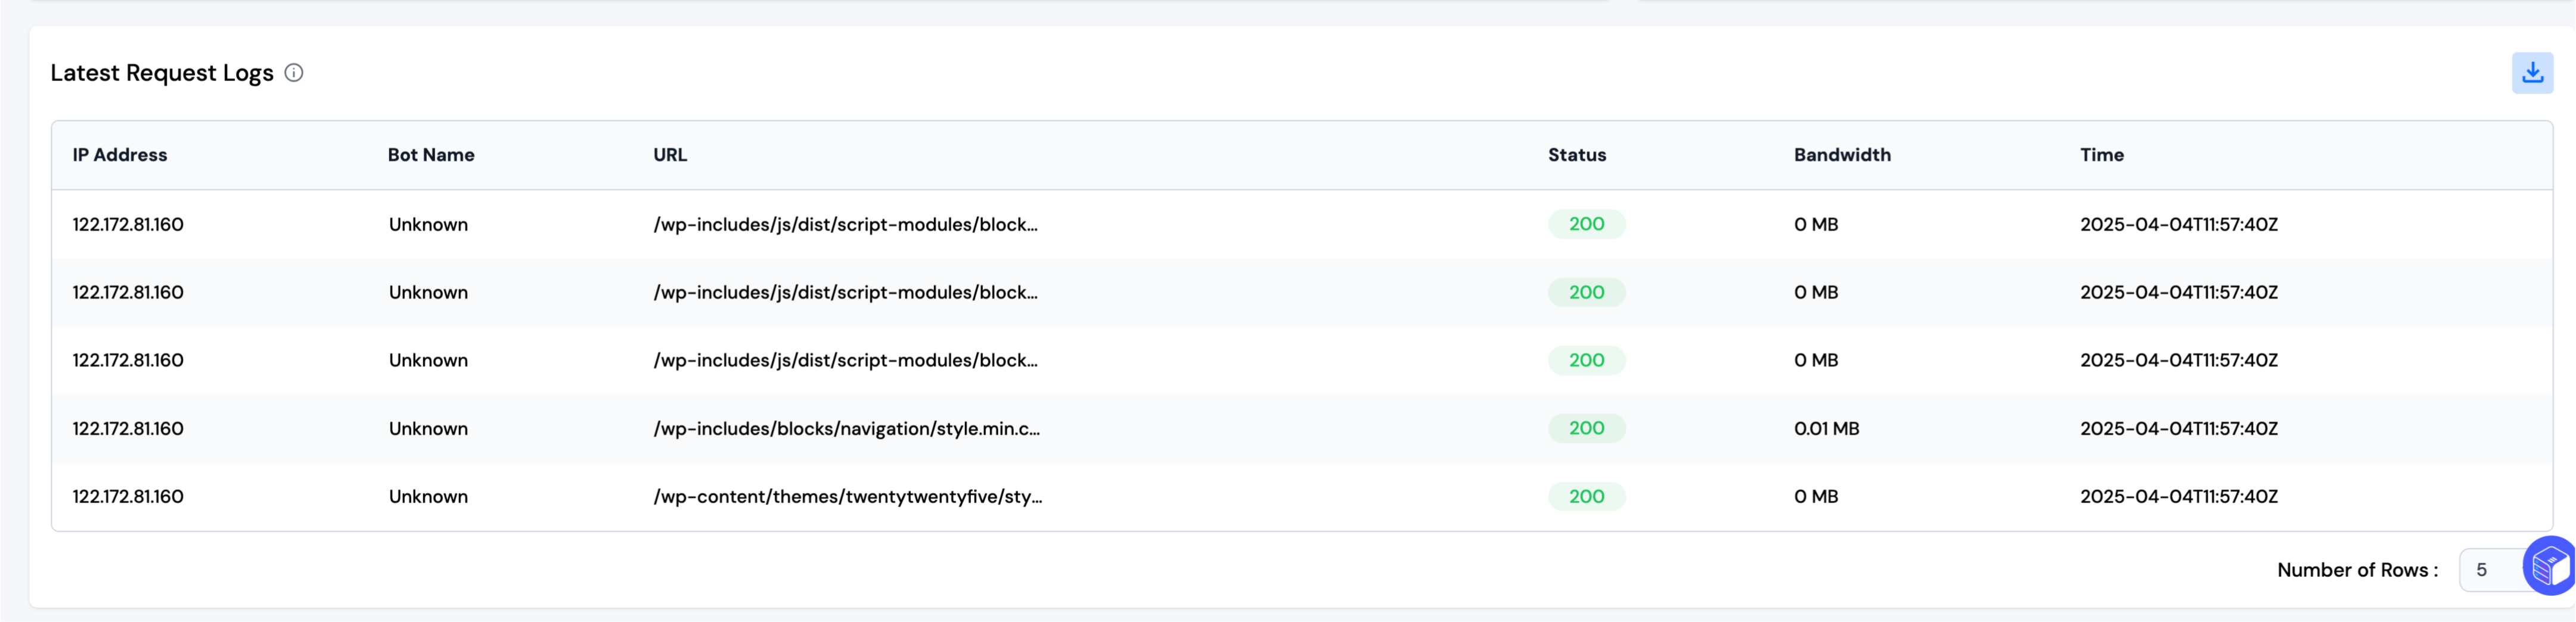
Latest Request Logs
The latest request logs provide real-time tracking of incoming requests, including details such as the originating IP address, whether the request was made by a bot, the URL path requested, the HTTP status code returned, the bandwidth consumed, and the precise timestamp of the request. This data allows developers to diagnose potential issues, detect malicious traffic, and ensure the smooth functioning of the application.
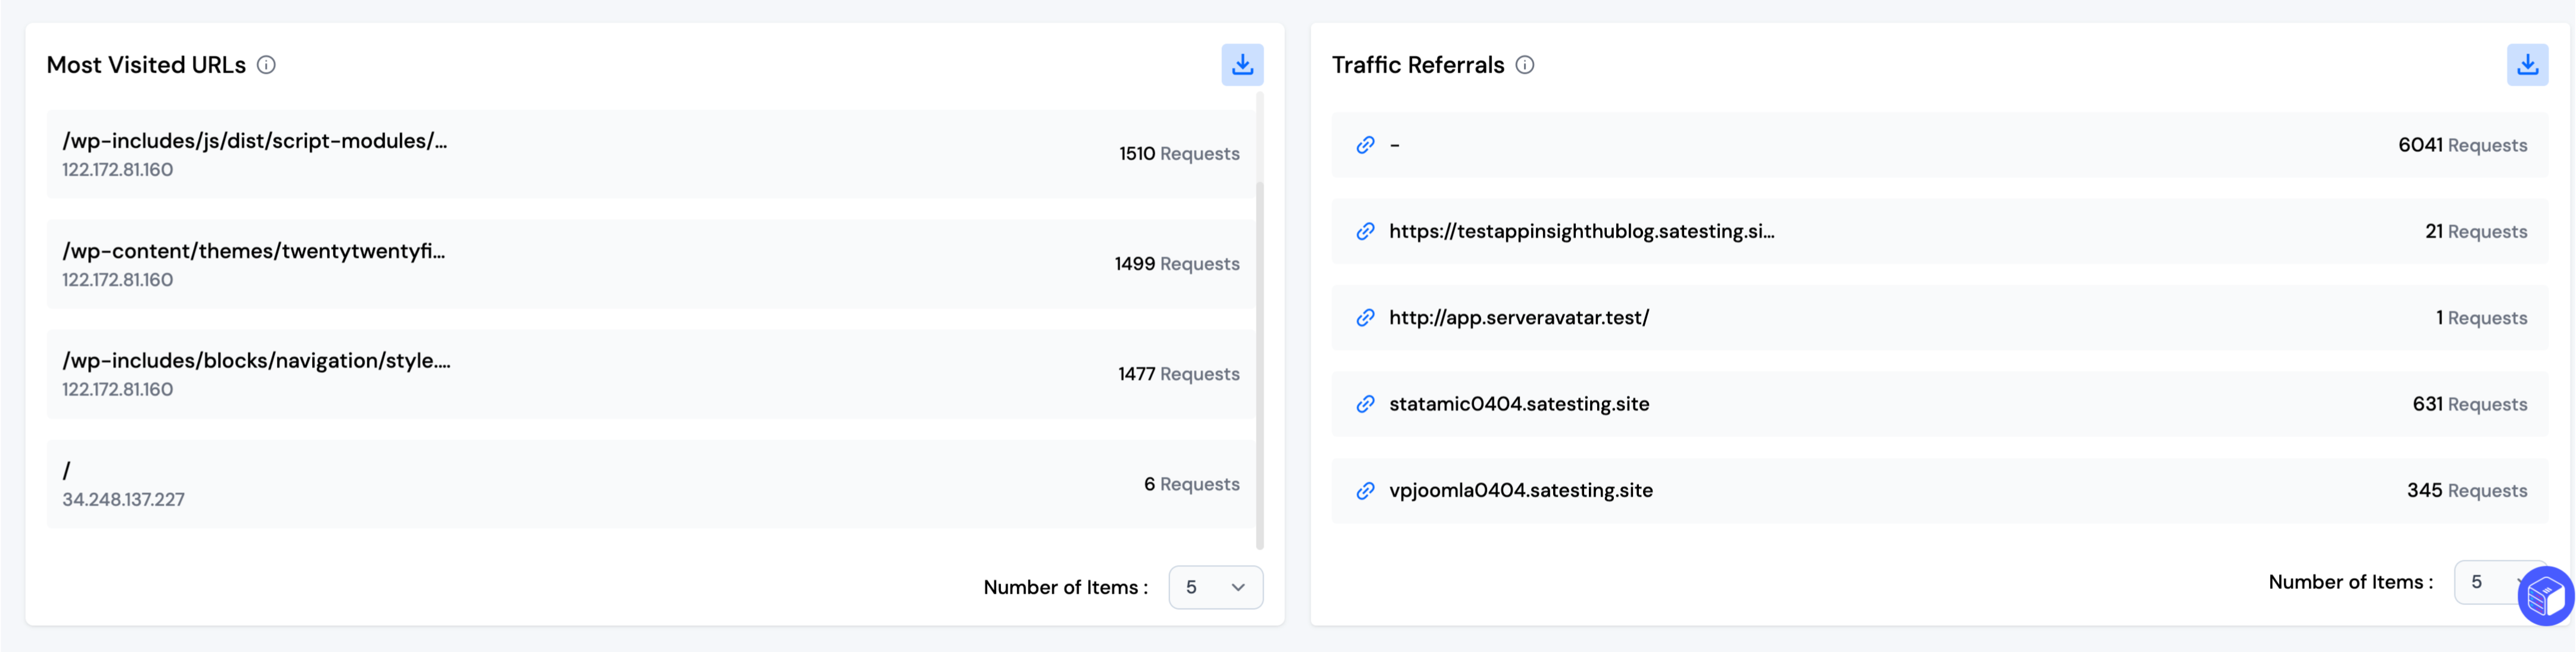
Most Visited URLs
The most visited URLs section highlights which pages or resources receive the highest traffic. Understanding which endpoints are most frequently accessed allows developers to optimize content loading speeds, implement caching mechanisms, and identify any potential performance bottlenecks.
Traffic Referrals
Traffic referrals show the sources that drive visitors to the application. This data helps in understanding user acquisition channels, identifying high-value referrers, and detecting unauthorized or spam traffic. Referral tracking is crucial for businesses looking to improve their inbound marketing strategies.
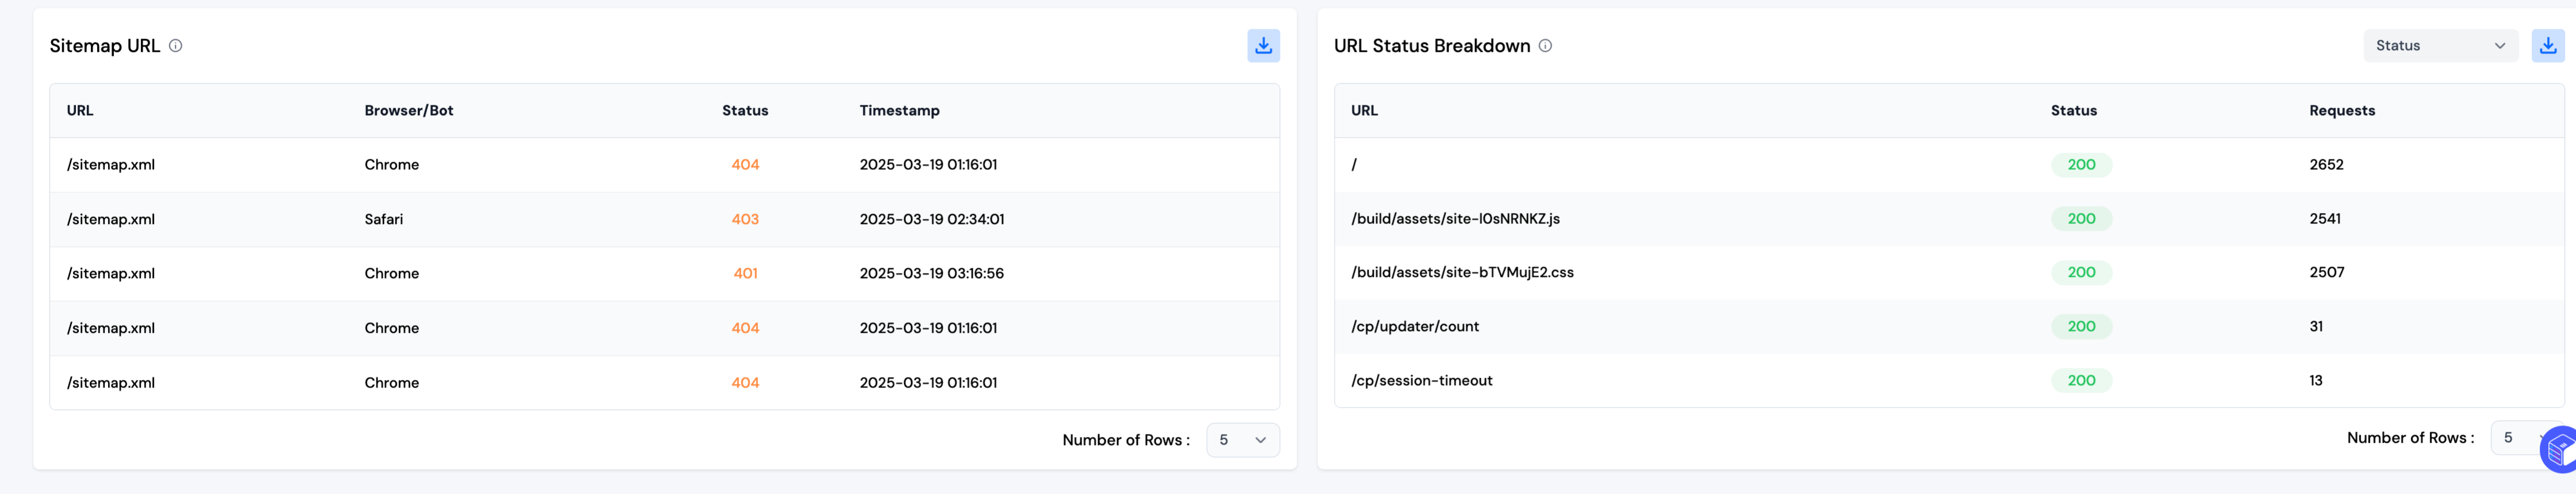
Sitemap URL
The sitemap section indicates whether a sitemap is detected for the application. A missing sitemap may affect search engine indexing and overall discoverability. If no data is found, it suggests that a sitemap needs to be configured for improved SEO performance.
URL Status Breakdown
This section categorizes accessed URLs based on their HTTP response codes, helping administrators analyze system performance. URLs with a 200 status indicate successful responses, while 301 or 302 statuses signify redirects. Errors such as 404 (Not Found) or 500 (Server Errors) highlight areas that require attention, ensuring a seamless user experience by minimizing broken links and server failures.
The Traffic Monitoring Dashboard equips developers and administrators with vital insights into visitor behavior, request patterns, and potential security risks, allowing them to optimize application performance efficiently.
Note: You can download the full data of the table as a CSV file using the download button. By default, five rows are shown, but you can increase the count using the dropdown menu.